Eucon
The design process for redesigning insurance companies' favorite digital tool
About Eucon
Eucon is a digital pioneer in data and process intelligence, offering a web app tool that has been supporting companies in the automotive, insurance, and real estate industries for more than 20 years in digitalizing their processes.
My Role
I led the User Experience and User Interface design of this project for about 6 months. I also received constructive feedback from the product owner and a fellow designer in order to improve and get different perspectives on what I was designing.
- Customer Insights & Ideation
- Building the Project Vision
- User Interface & Experience
- Motion & Interactions
- Illustrations
- Onboarding of designer colleague
18%
Profit increase
37%
Reduced design & dev time
10
User interviews conducted

The Challenge
How do you modernize a 20-year-old enterprise tool without disrupting the daily workflow of power users?
Goal 01
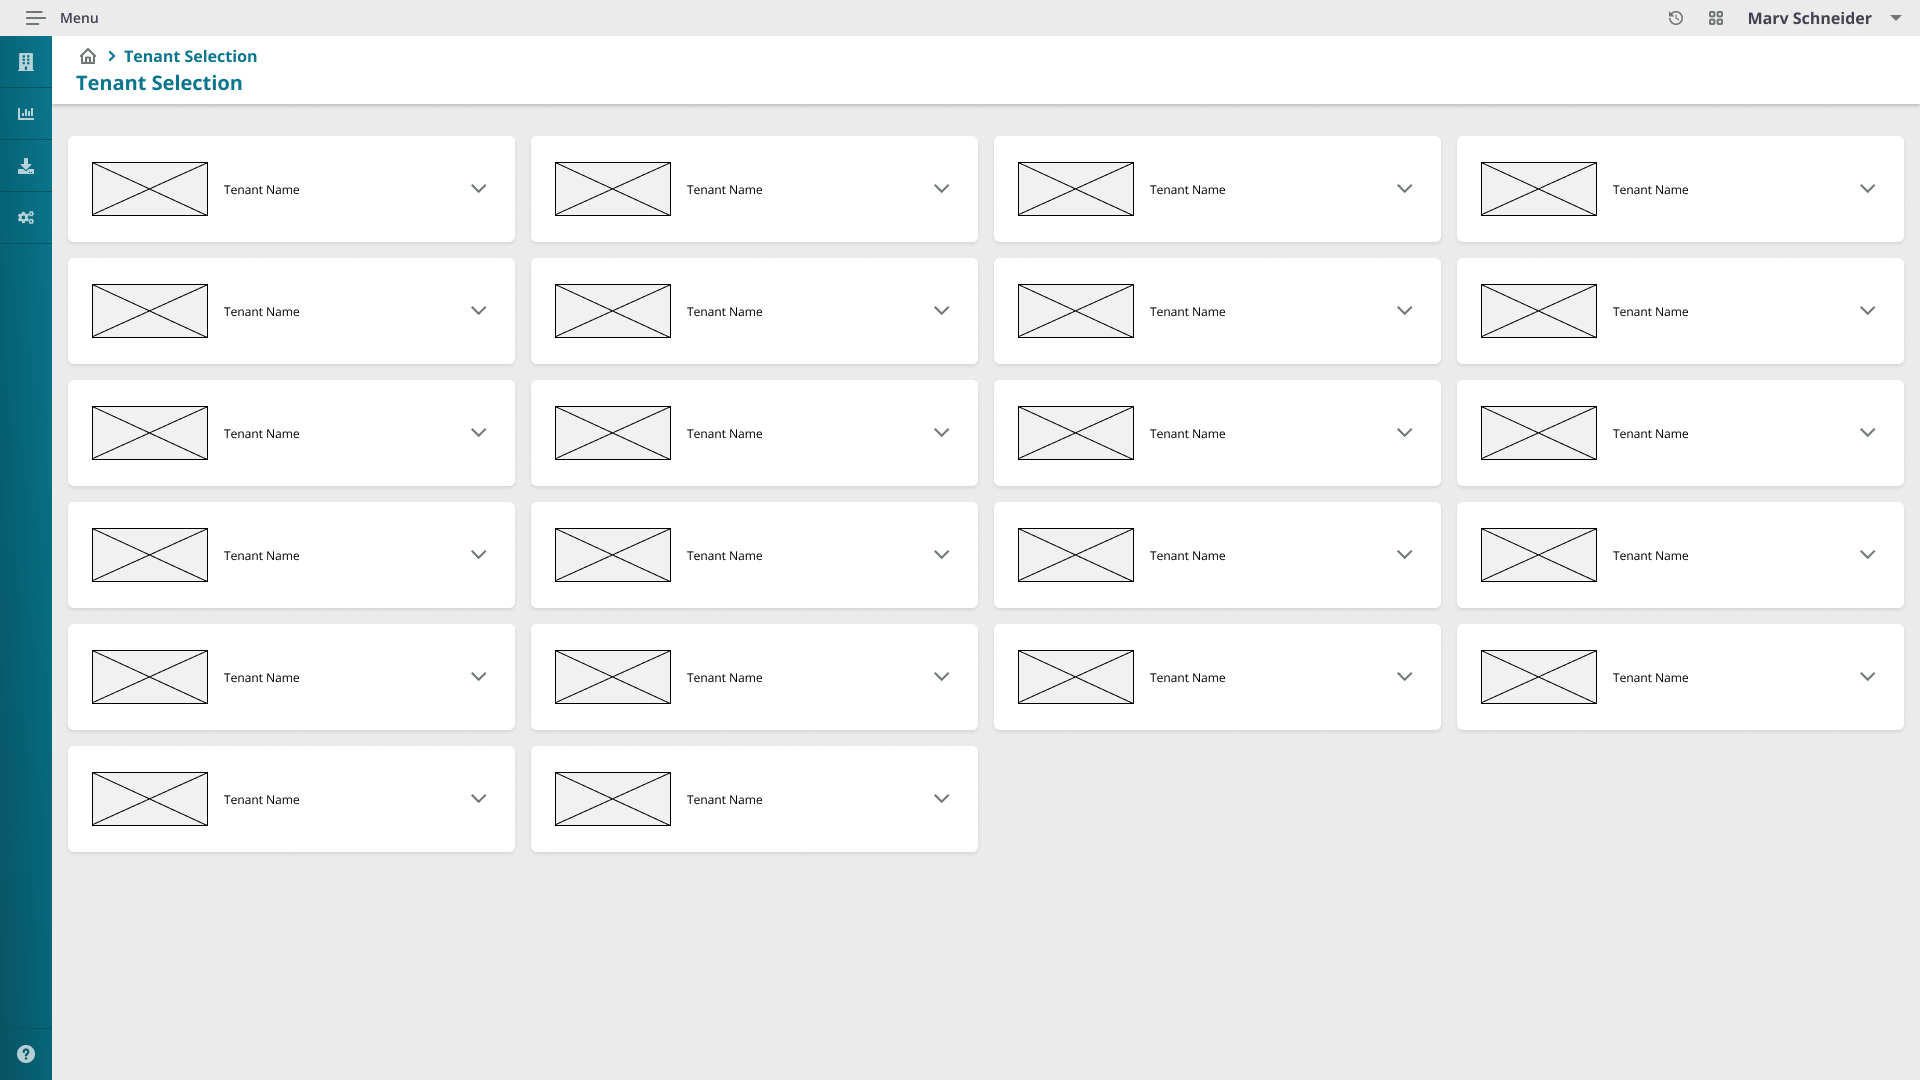
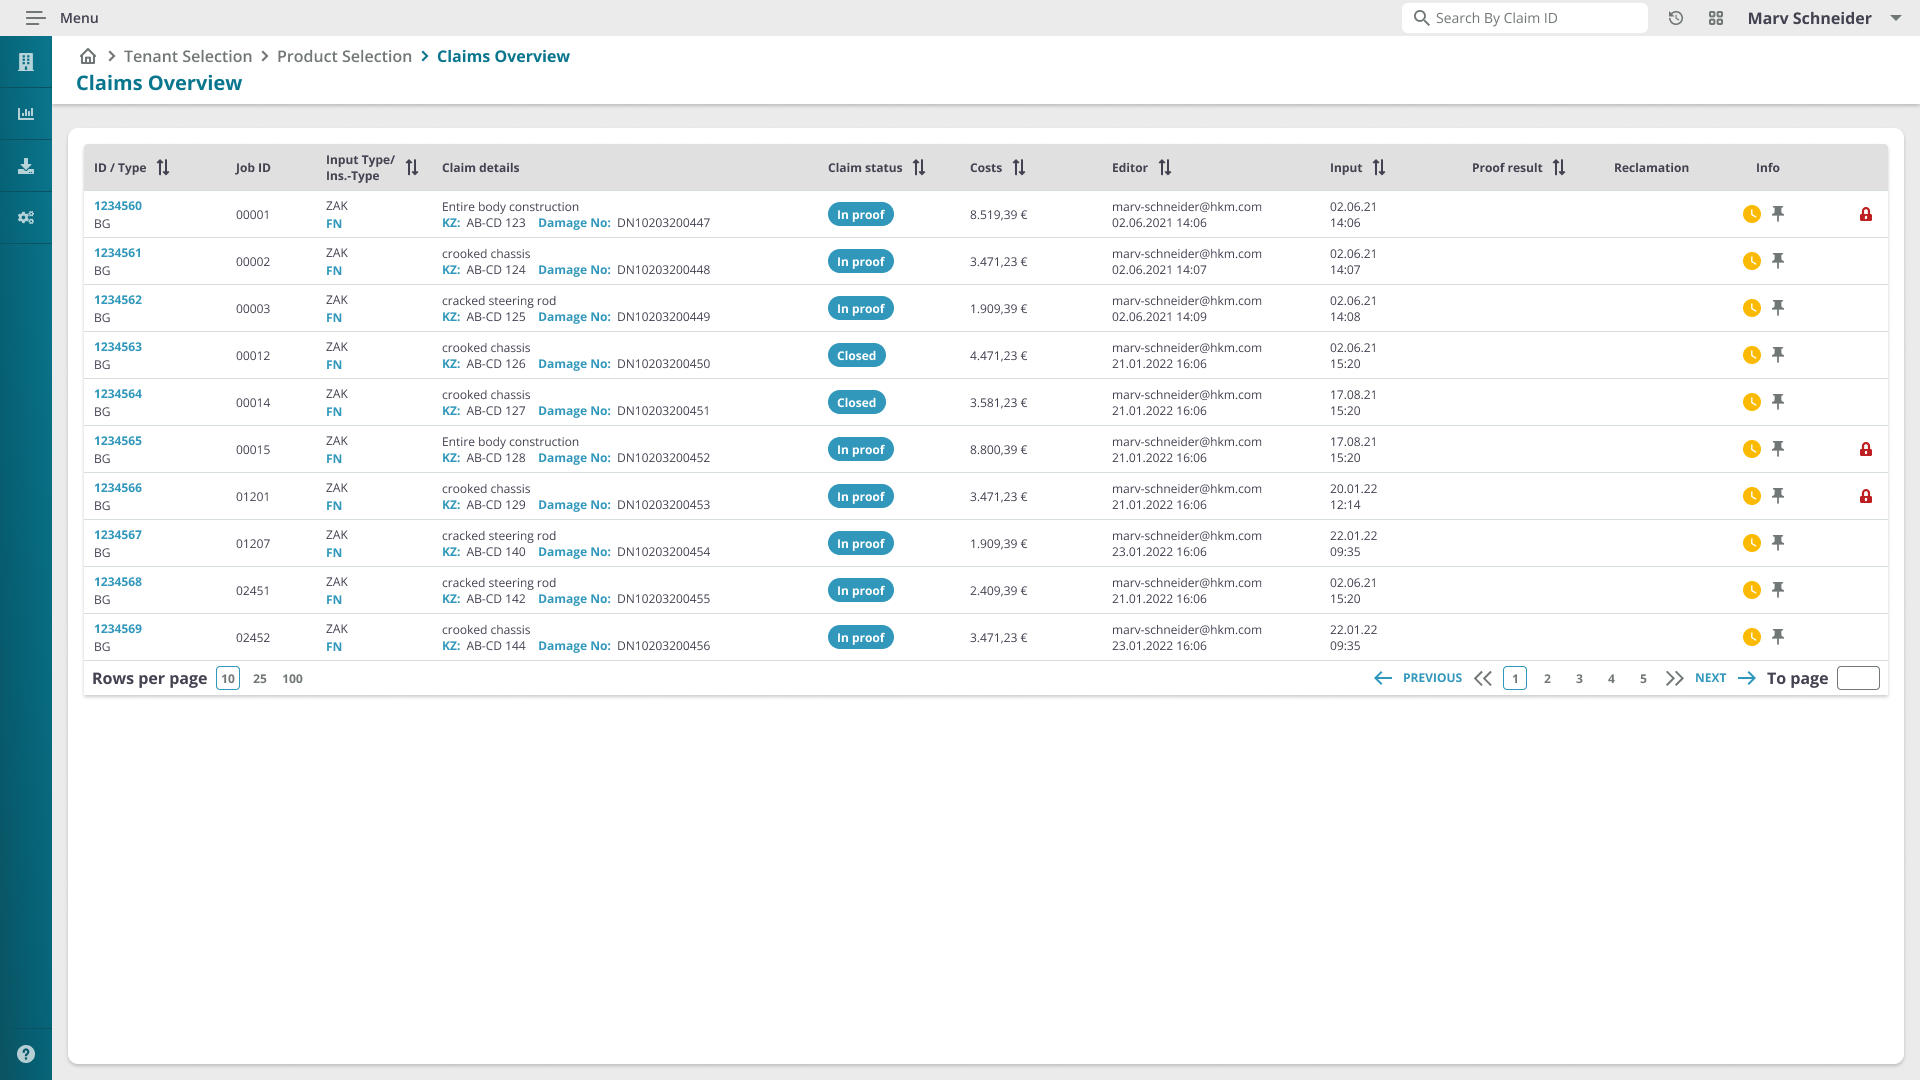
Create tables with complex functionalities and structure all the needed information on individual pages, based on their large dataset, in the most understandable and productive way for the users.
Goal 02
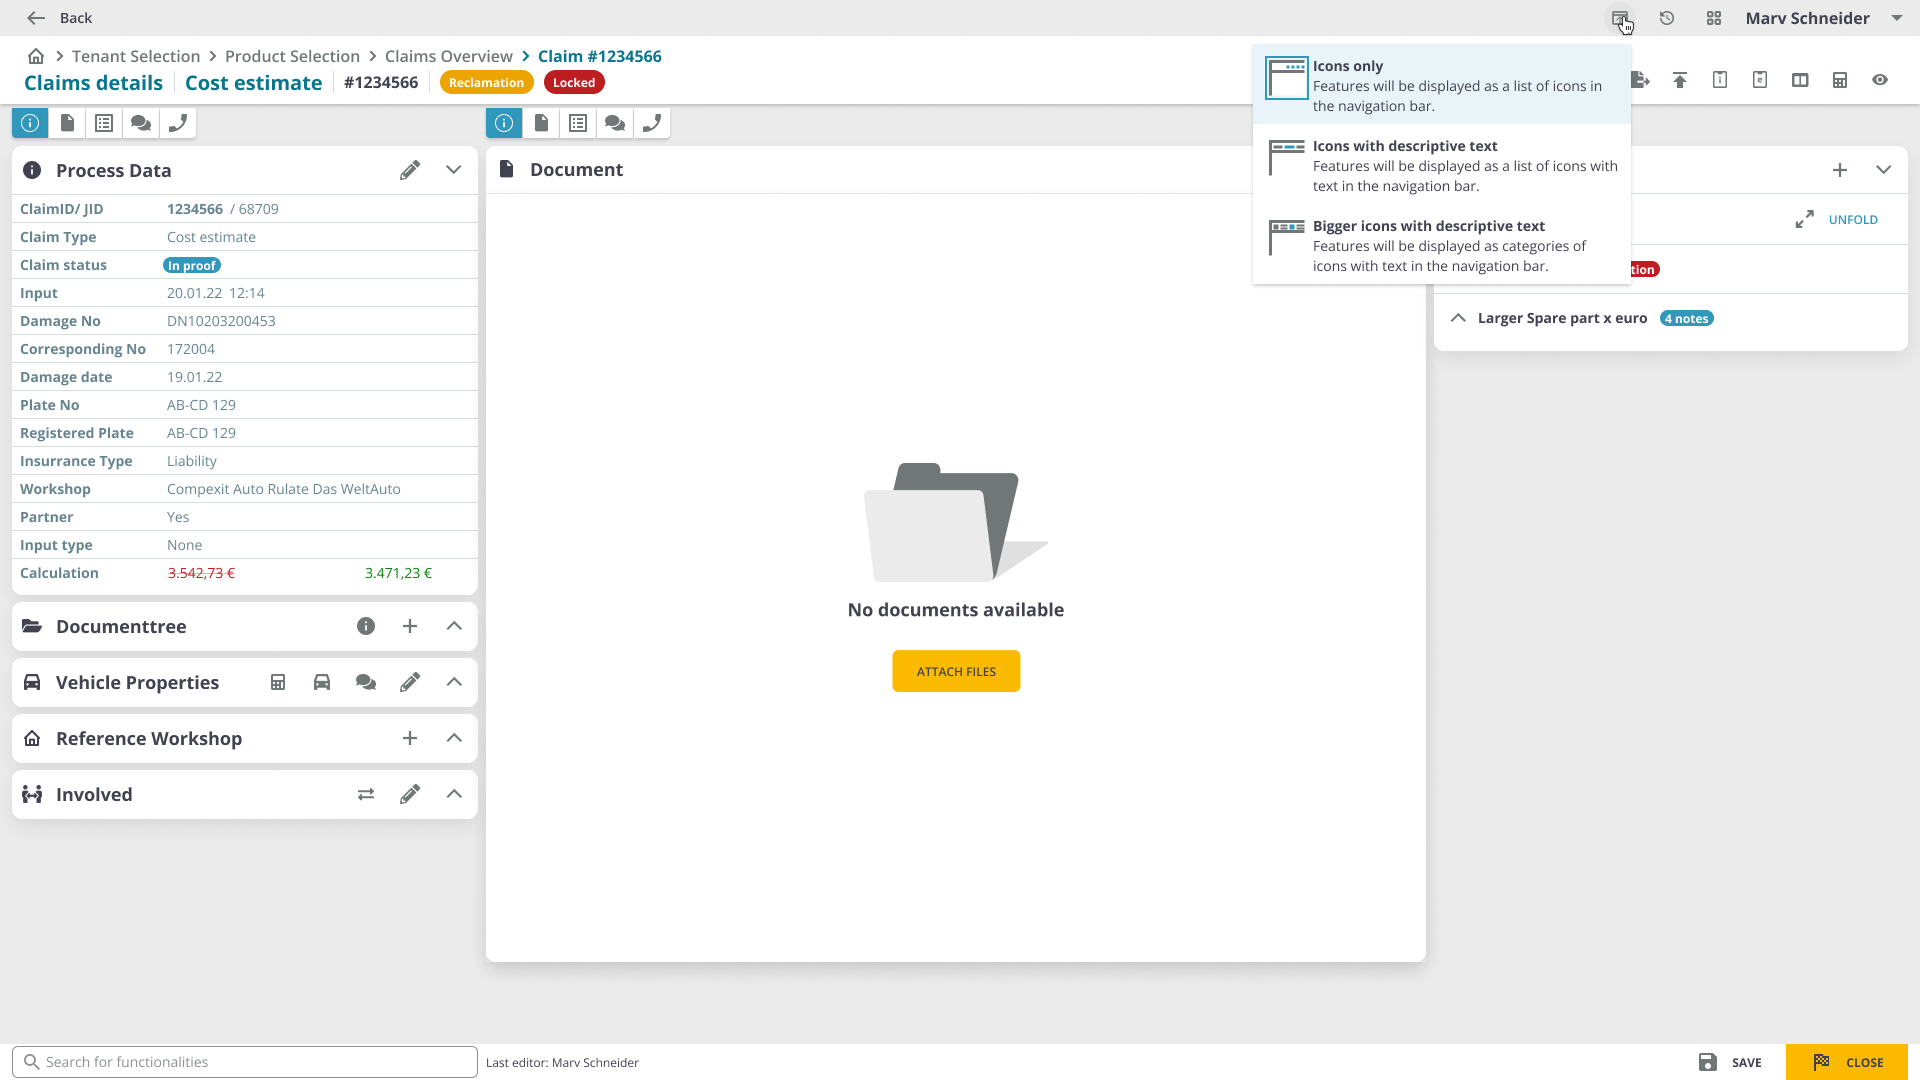
Redesign the app step by step, making unintrusive visual changes that are nevertheless significant for the user experience with each new release, not to complicate users' usual flows, but to bring useful changes that help improve their productivity.
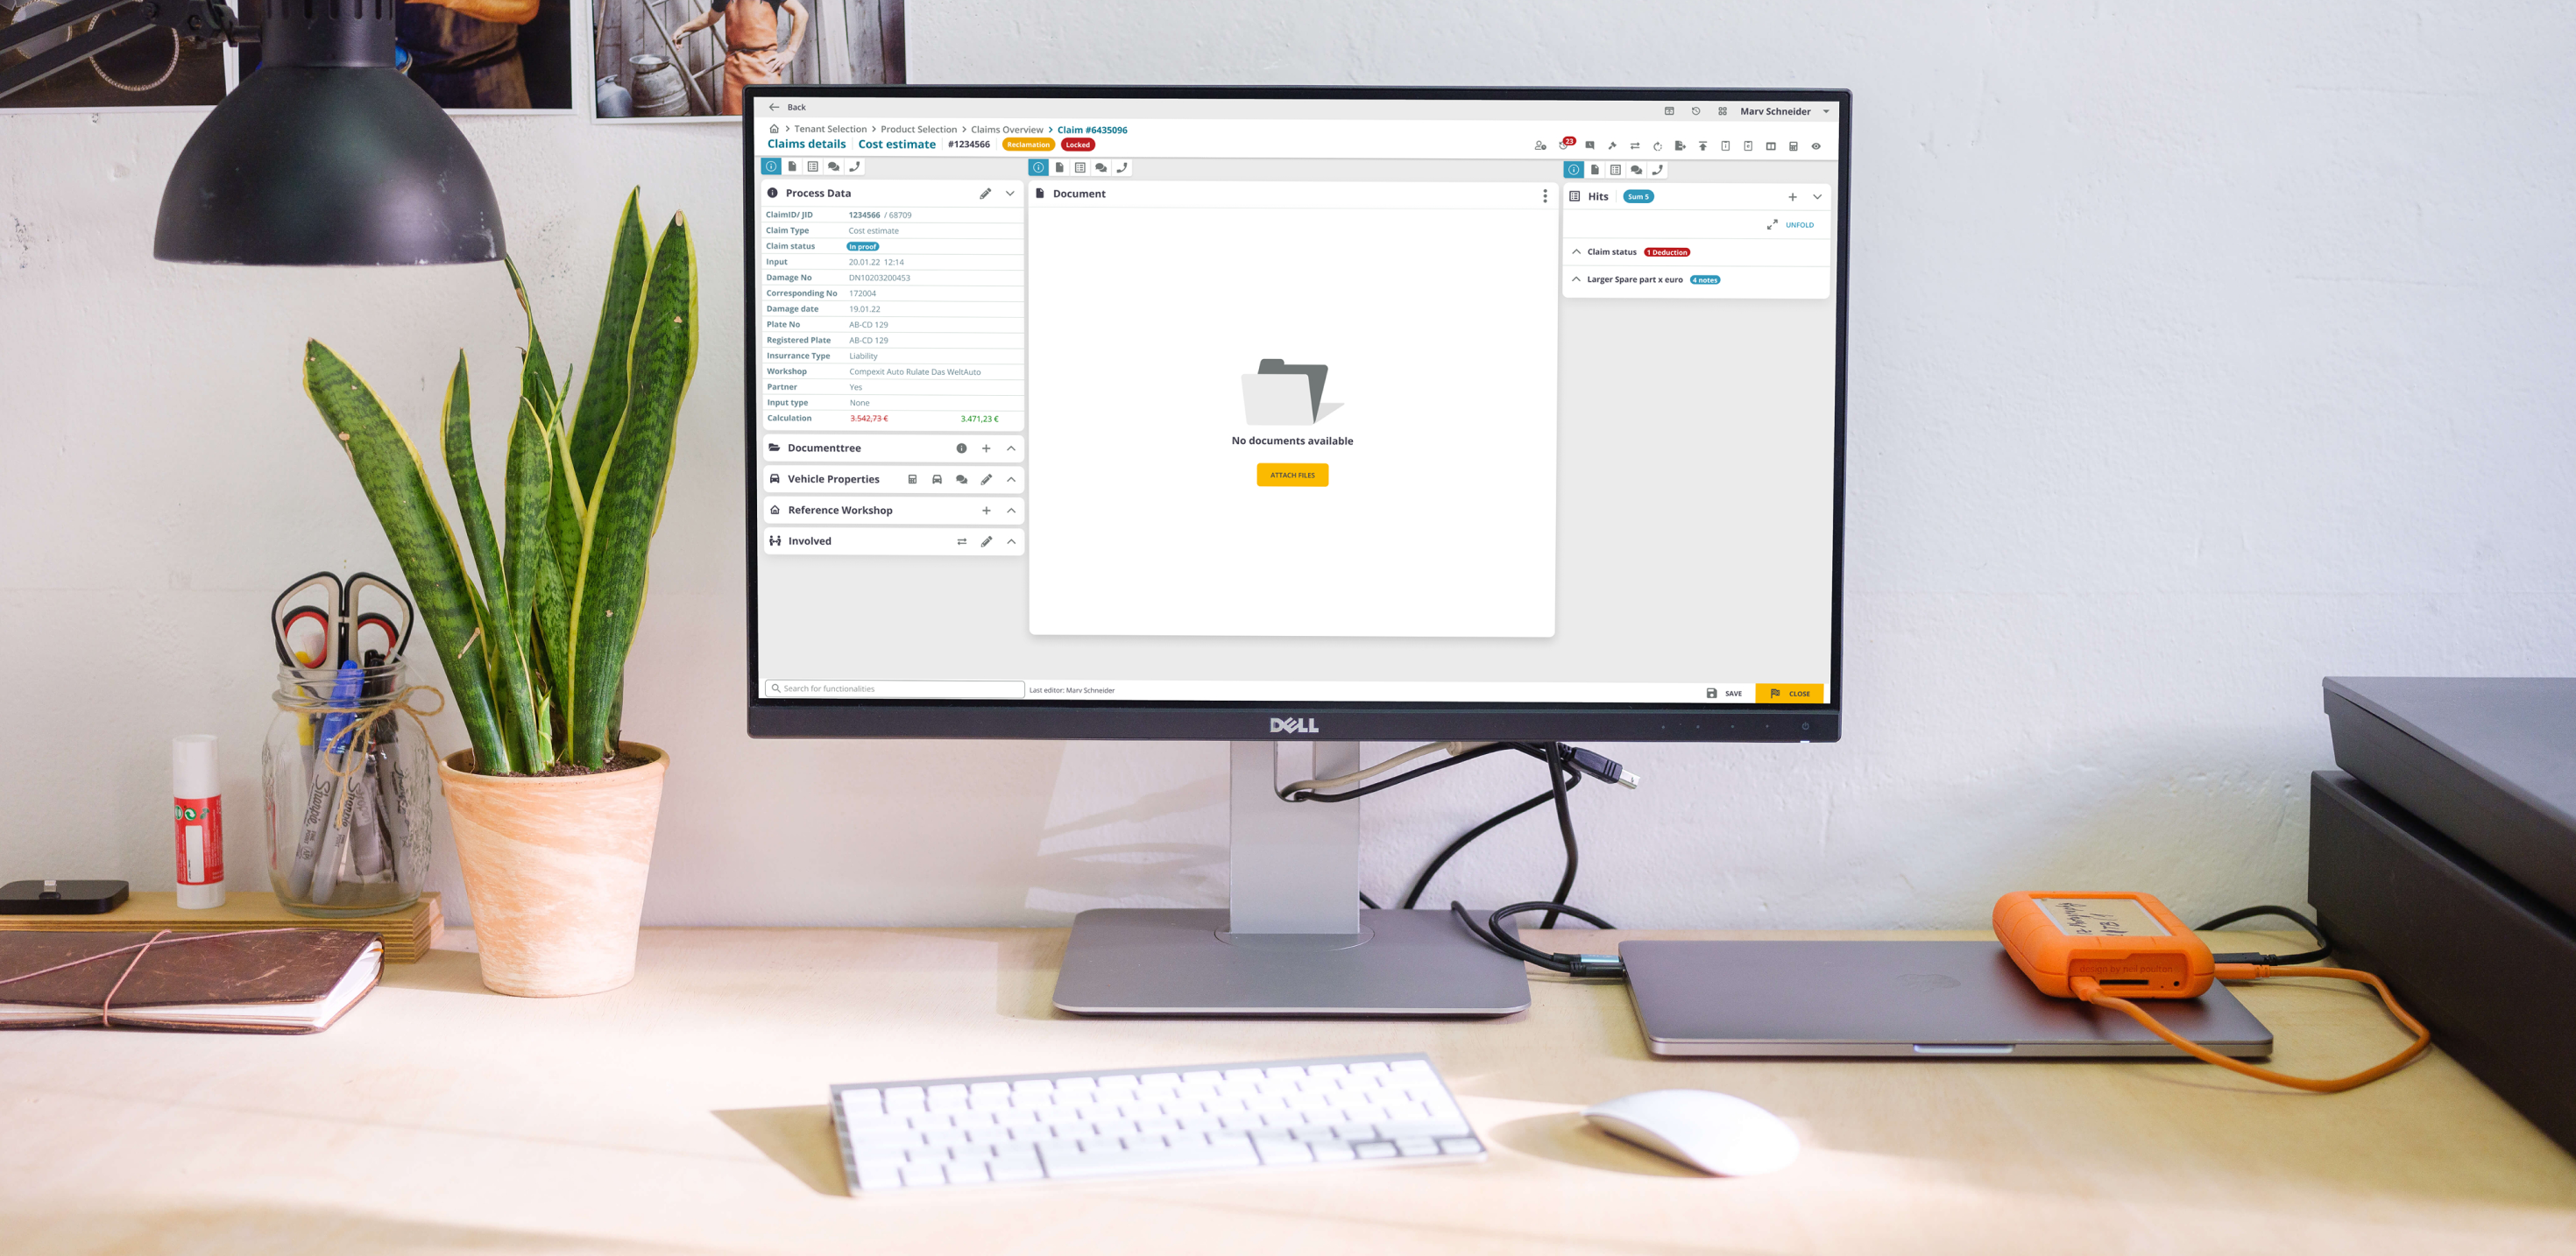
About the Webapp
Eucon is a digital solution partner. Its value proposition is to offer insurers digital solutions for automating their automobile and property claims management.
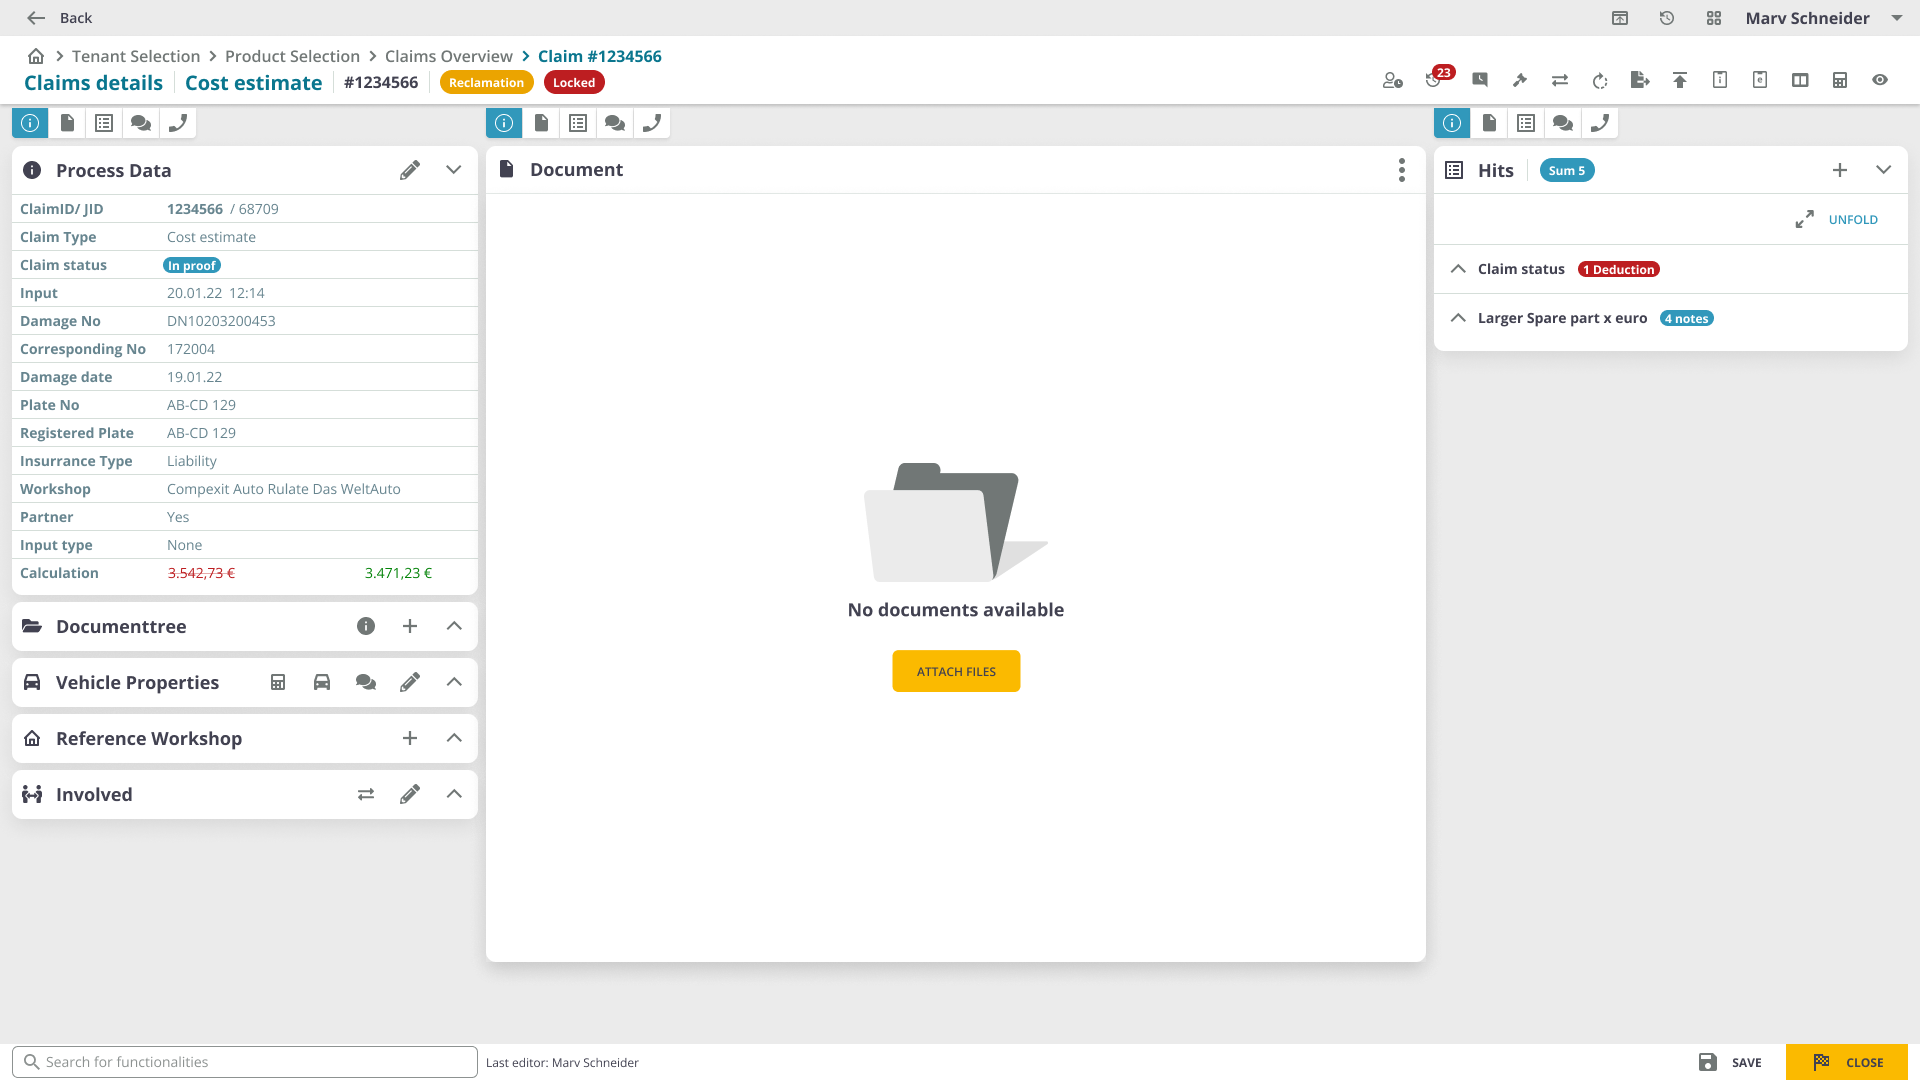
Insurance companies use Eucon to verify car damage calculations, manage automobile and property claims, prevent fraud through documentation, and generate final compensation reports. The main claim page displays claim details, documents, and action options so users can verify, edit, and generate the final report.
Concept
A digital solution that not only automates insurers' automobile and property claims management, but also provides a friendly environment which helps every employee to be productive and accurate in their day-to-day work.

Design Process
From research to validation: a structured approach
The first step was to gather all the information about the design documents and create a list of everything missing that required documentation. Then desk research to understand how the current product is used and how users behave. It's important to get this information early, before having an idea or prototyping.
After analyzing these insights, I began to conceptualize the solution, focusing on user flows and wireframes to facilitate faster iteration. Then I moved into production, designing the interface considering principles of contrast, hierarchy, feedback, brand attributes, user interactions, and data visualization. Once ready, I took feedback from the product owner and validated through workshops with current users.

01
Information Gathering
Documentation gap analysis and understanding the existing product landscape.
02
Desk Research
Studied UX patterns in big data applications, including dashboards from Walmart, SAS, SAP, and IBM.
03
User Interviews
10 interviews (~45 min each) covering demographics, pain points, device usage, and daily workflows.
04
Conceptualization
User flows and wireframes to structure complex datasets into understandable page layouts.
05
Interface Production
Applied contrast, hierarchy, and feedback principles to build the final UI with a reusable component system.
06
Validation
Continuous user testing in workshops, dev team feedback, and iterative refinement.
User Research
Understanding real users through in-depth interviews
User interviews are a core UX method. I chose to interview 10 people, taking into account Donald Norman's recommendation that it's possible to learn about 80% of the errors, problems, and behavior from the first 6 users. That brought enough data and inputs to generate concepts and hypotheses. After the conceptualization phase, I took the prototype out to test it with other users for further feedback and validation.
Each interview lasted approximately 45 minutes and covered the following topics:
- General information: age, gender, marital status
- What products do you use for reading and editing documents?
- How comfortable are you with insurance documents management on a computer?
- How experienced are you in the car insurance field?
- What are your daily tasks in your insurance company?
- How frequently do you use the Eucon app in your work tasks?
- Where do you get the insurance forms and documents from?
- Do you take paper notes before updating a claim in the app?
- Do you use the Eucon app on a laptop or on a PC?
- How often do you feel that the app is slowing down your work process?
- What are your pain points in regards to the app?
Customer Insights
Two user personas with opposite adaptability to software changes
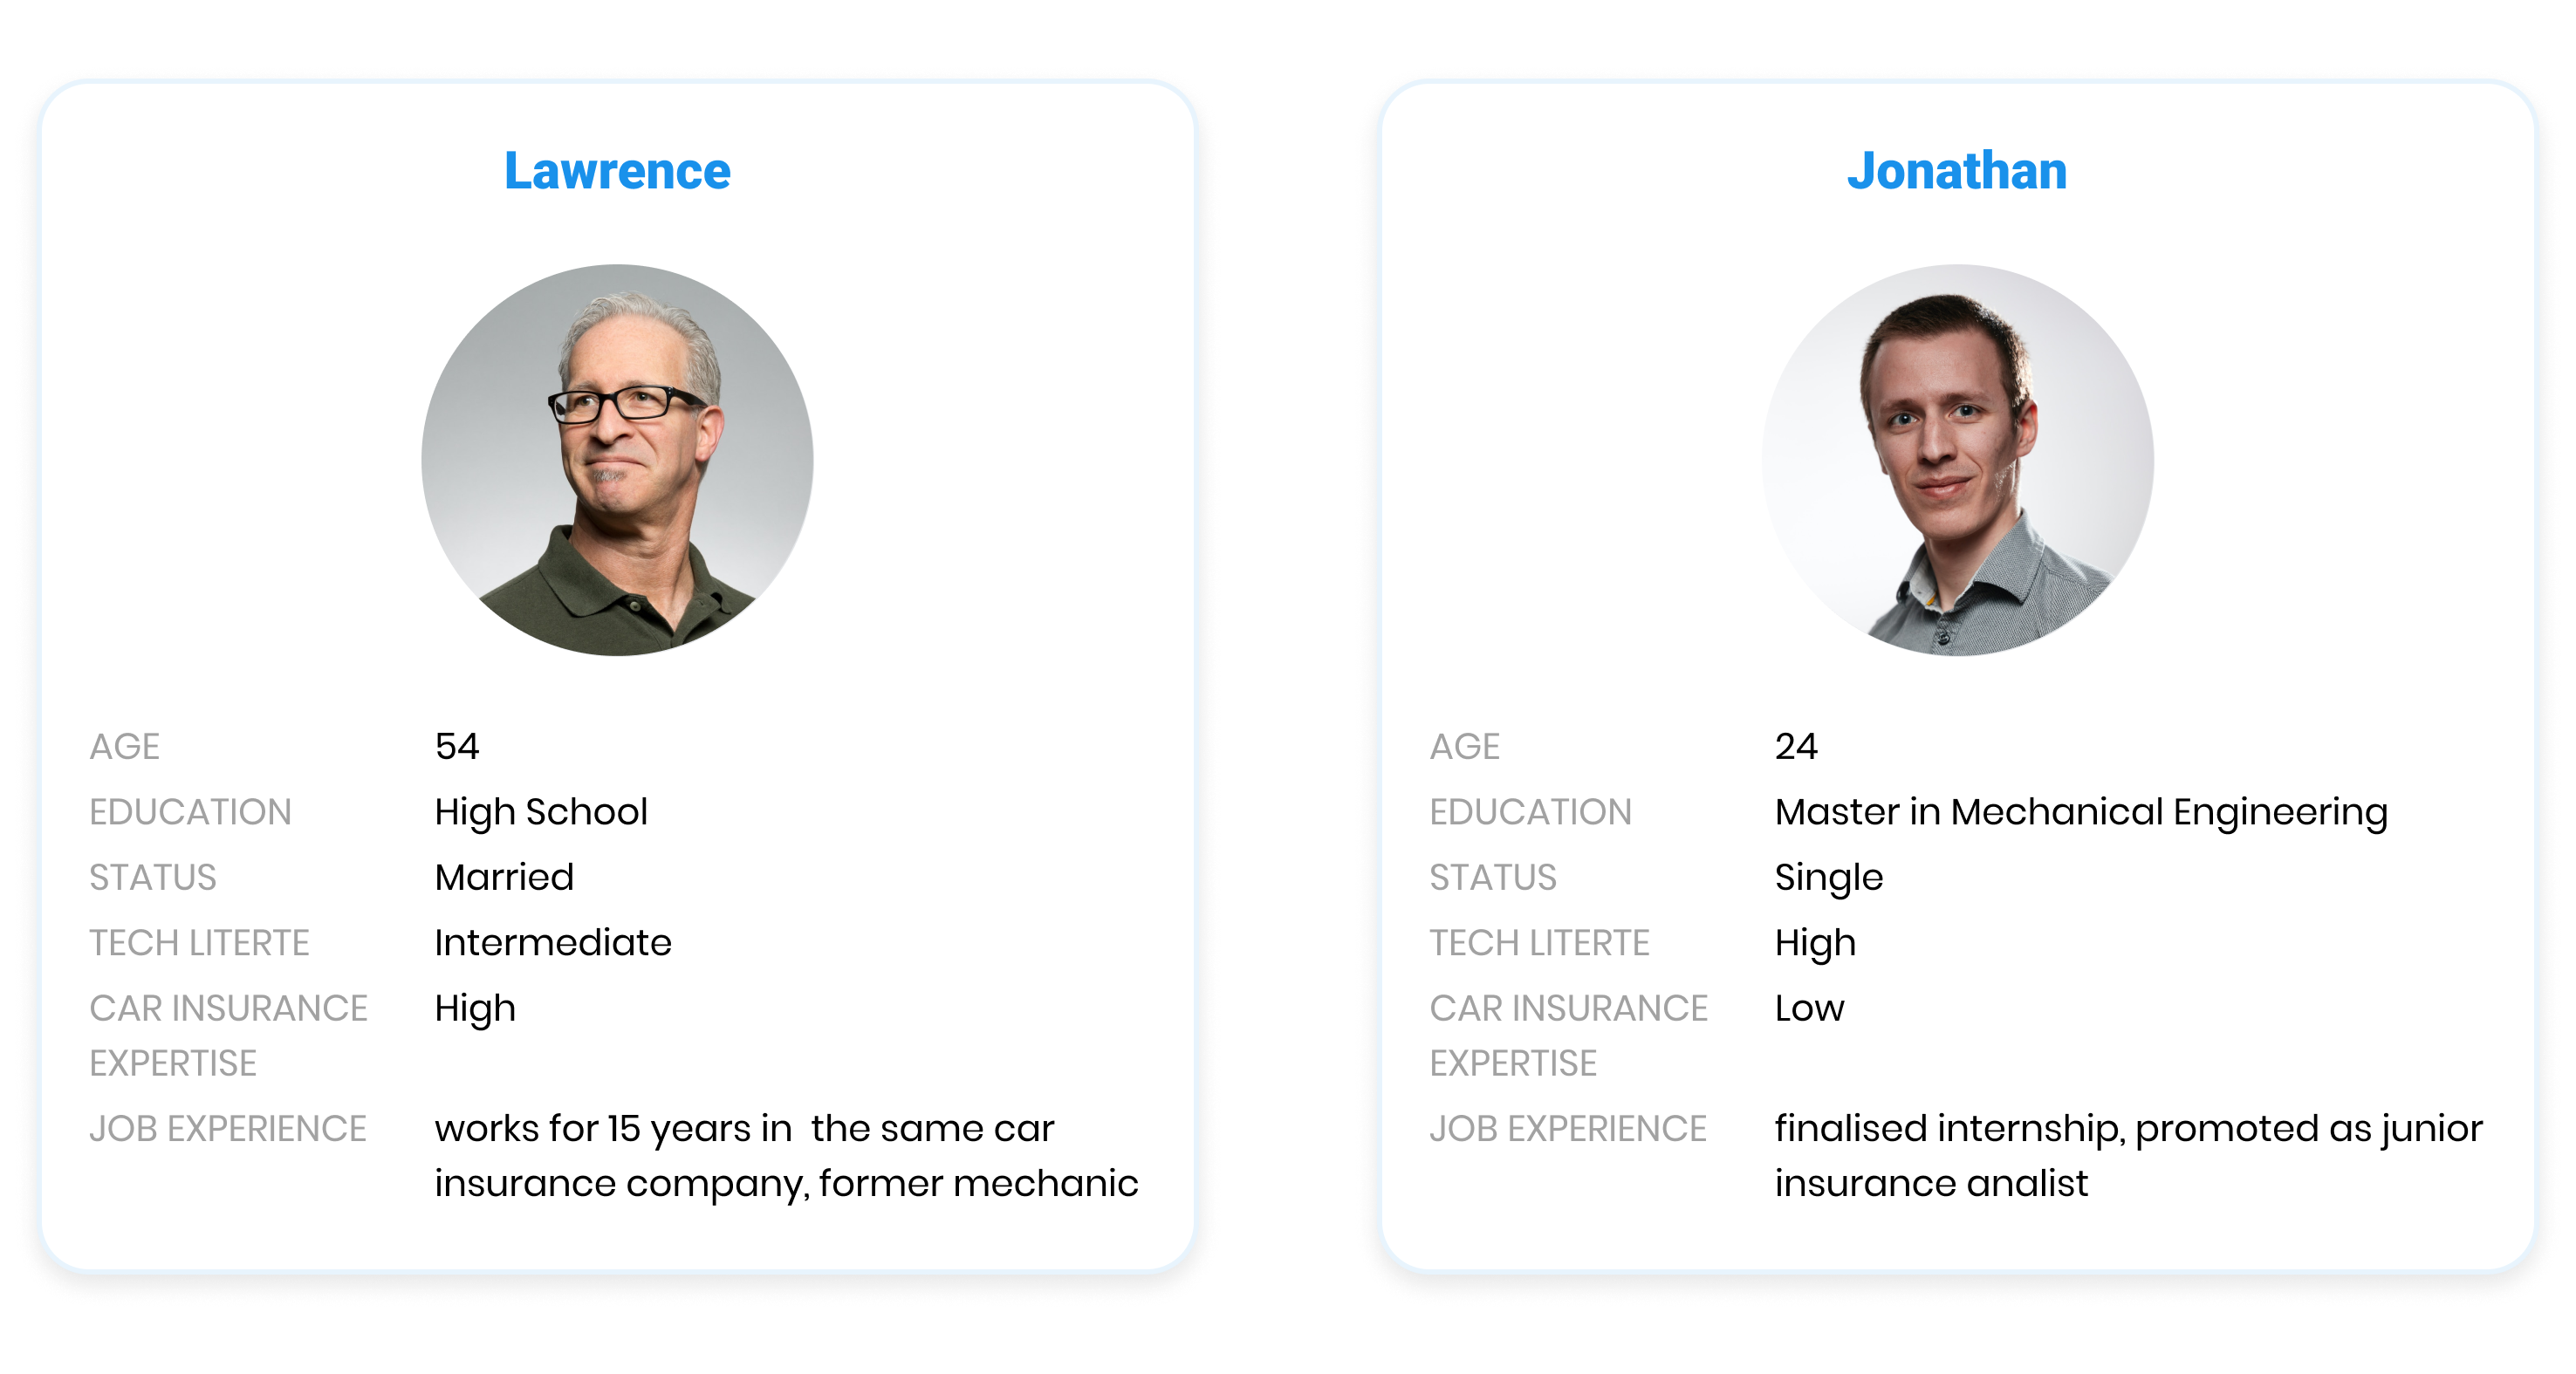
Having two personas with opposite adaptability to software changes, one of the main challenges was not to change the user interface and the app flow at the same time, but to make improvements gradually based on user feedback. The development team worked in sprints, and this way we managed to improve the user experience of the live product in a more natural way, one that didn't create difficulties for users in their daily tasks.
For me, it was extremely important not to slow down the work process for users, but to offer them a gradual learning of the new visuals, much simpler and easier to understand.
Desk Research
What is the role of UX Design in Big Data?
I also researched data and habits related to other big data companies. The article "UX Design for Big-Data Applications" by Janet M. Six brings relevant examples such as Walmart, SAS, SAP, and IBM, addressing different techniques for big-data visualization.
"The need for data visualization is especially important for complex structures such as those found in big data."
— Janet M. Six
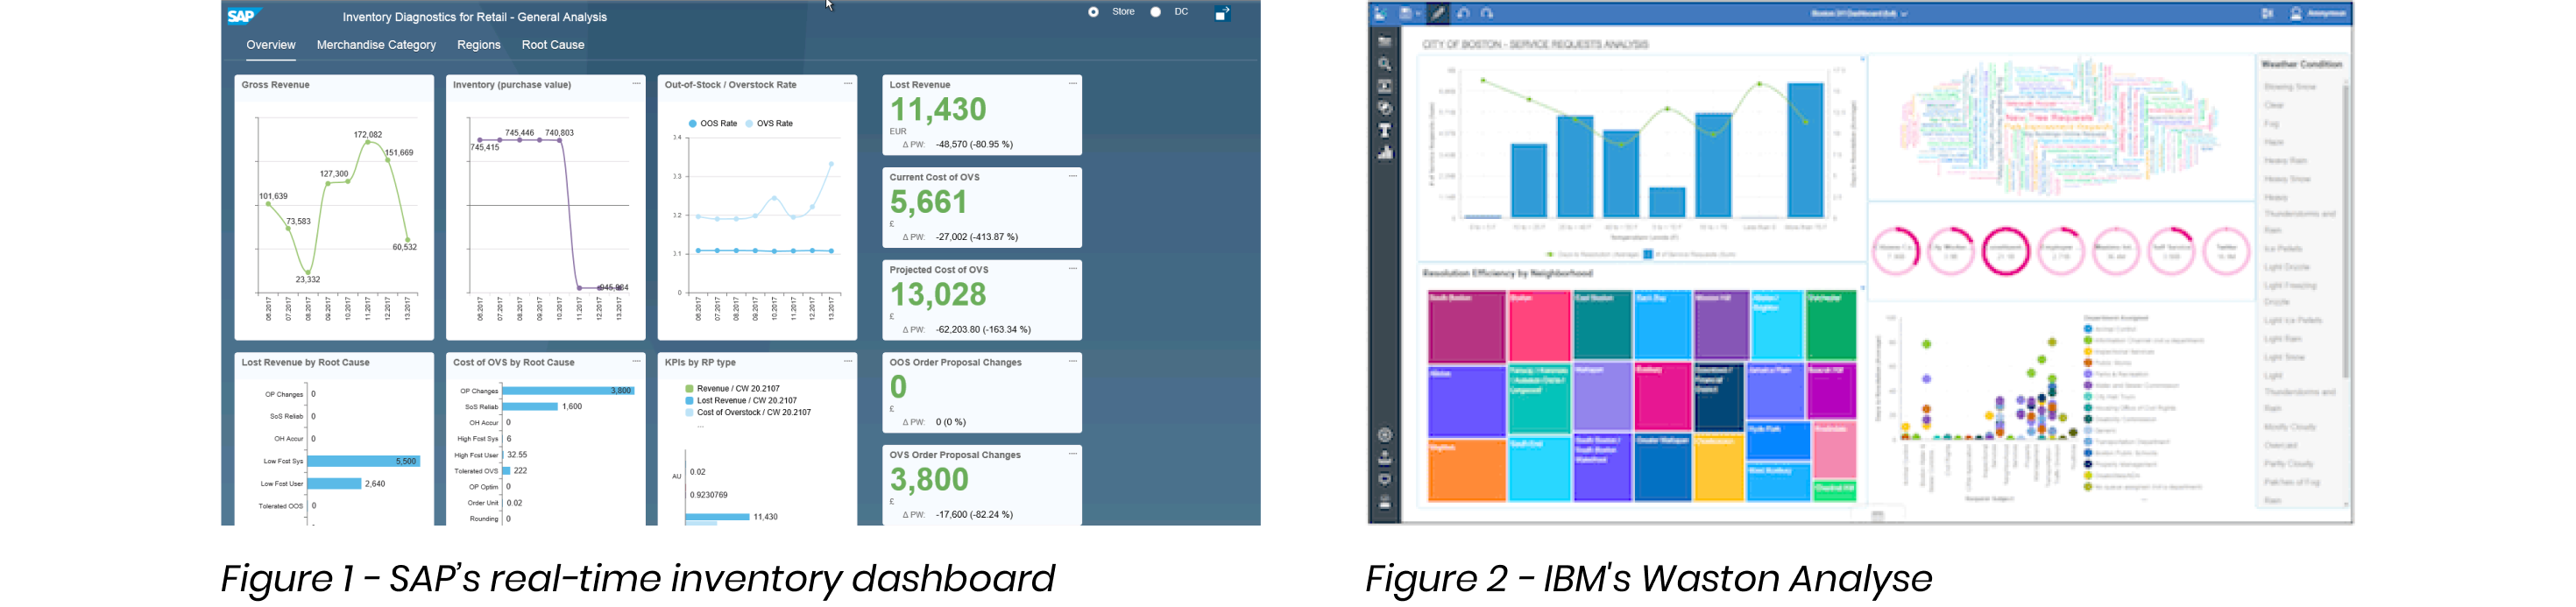
Dashboards can be more or less interactive. Some show the same types of data for different time periods, while others let users zoom in to view more detailed information. Others are completely static, showing all the relevant information in one place, in a sense, automatically generating an infographic.
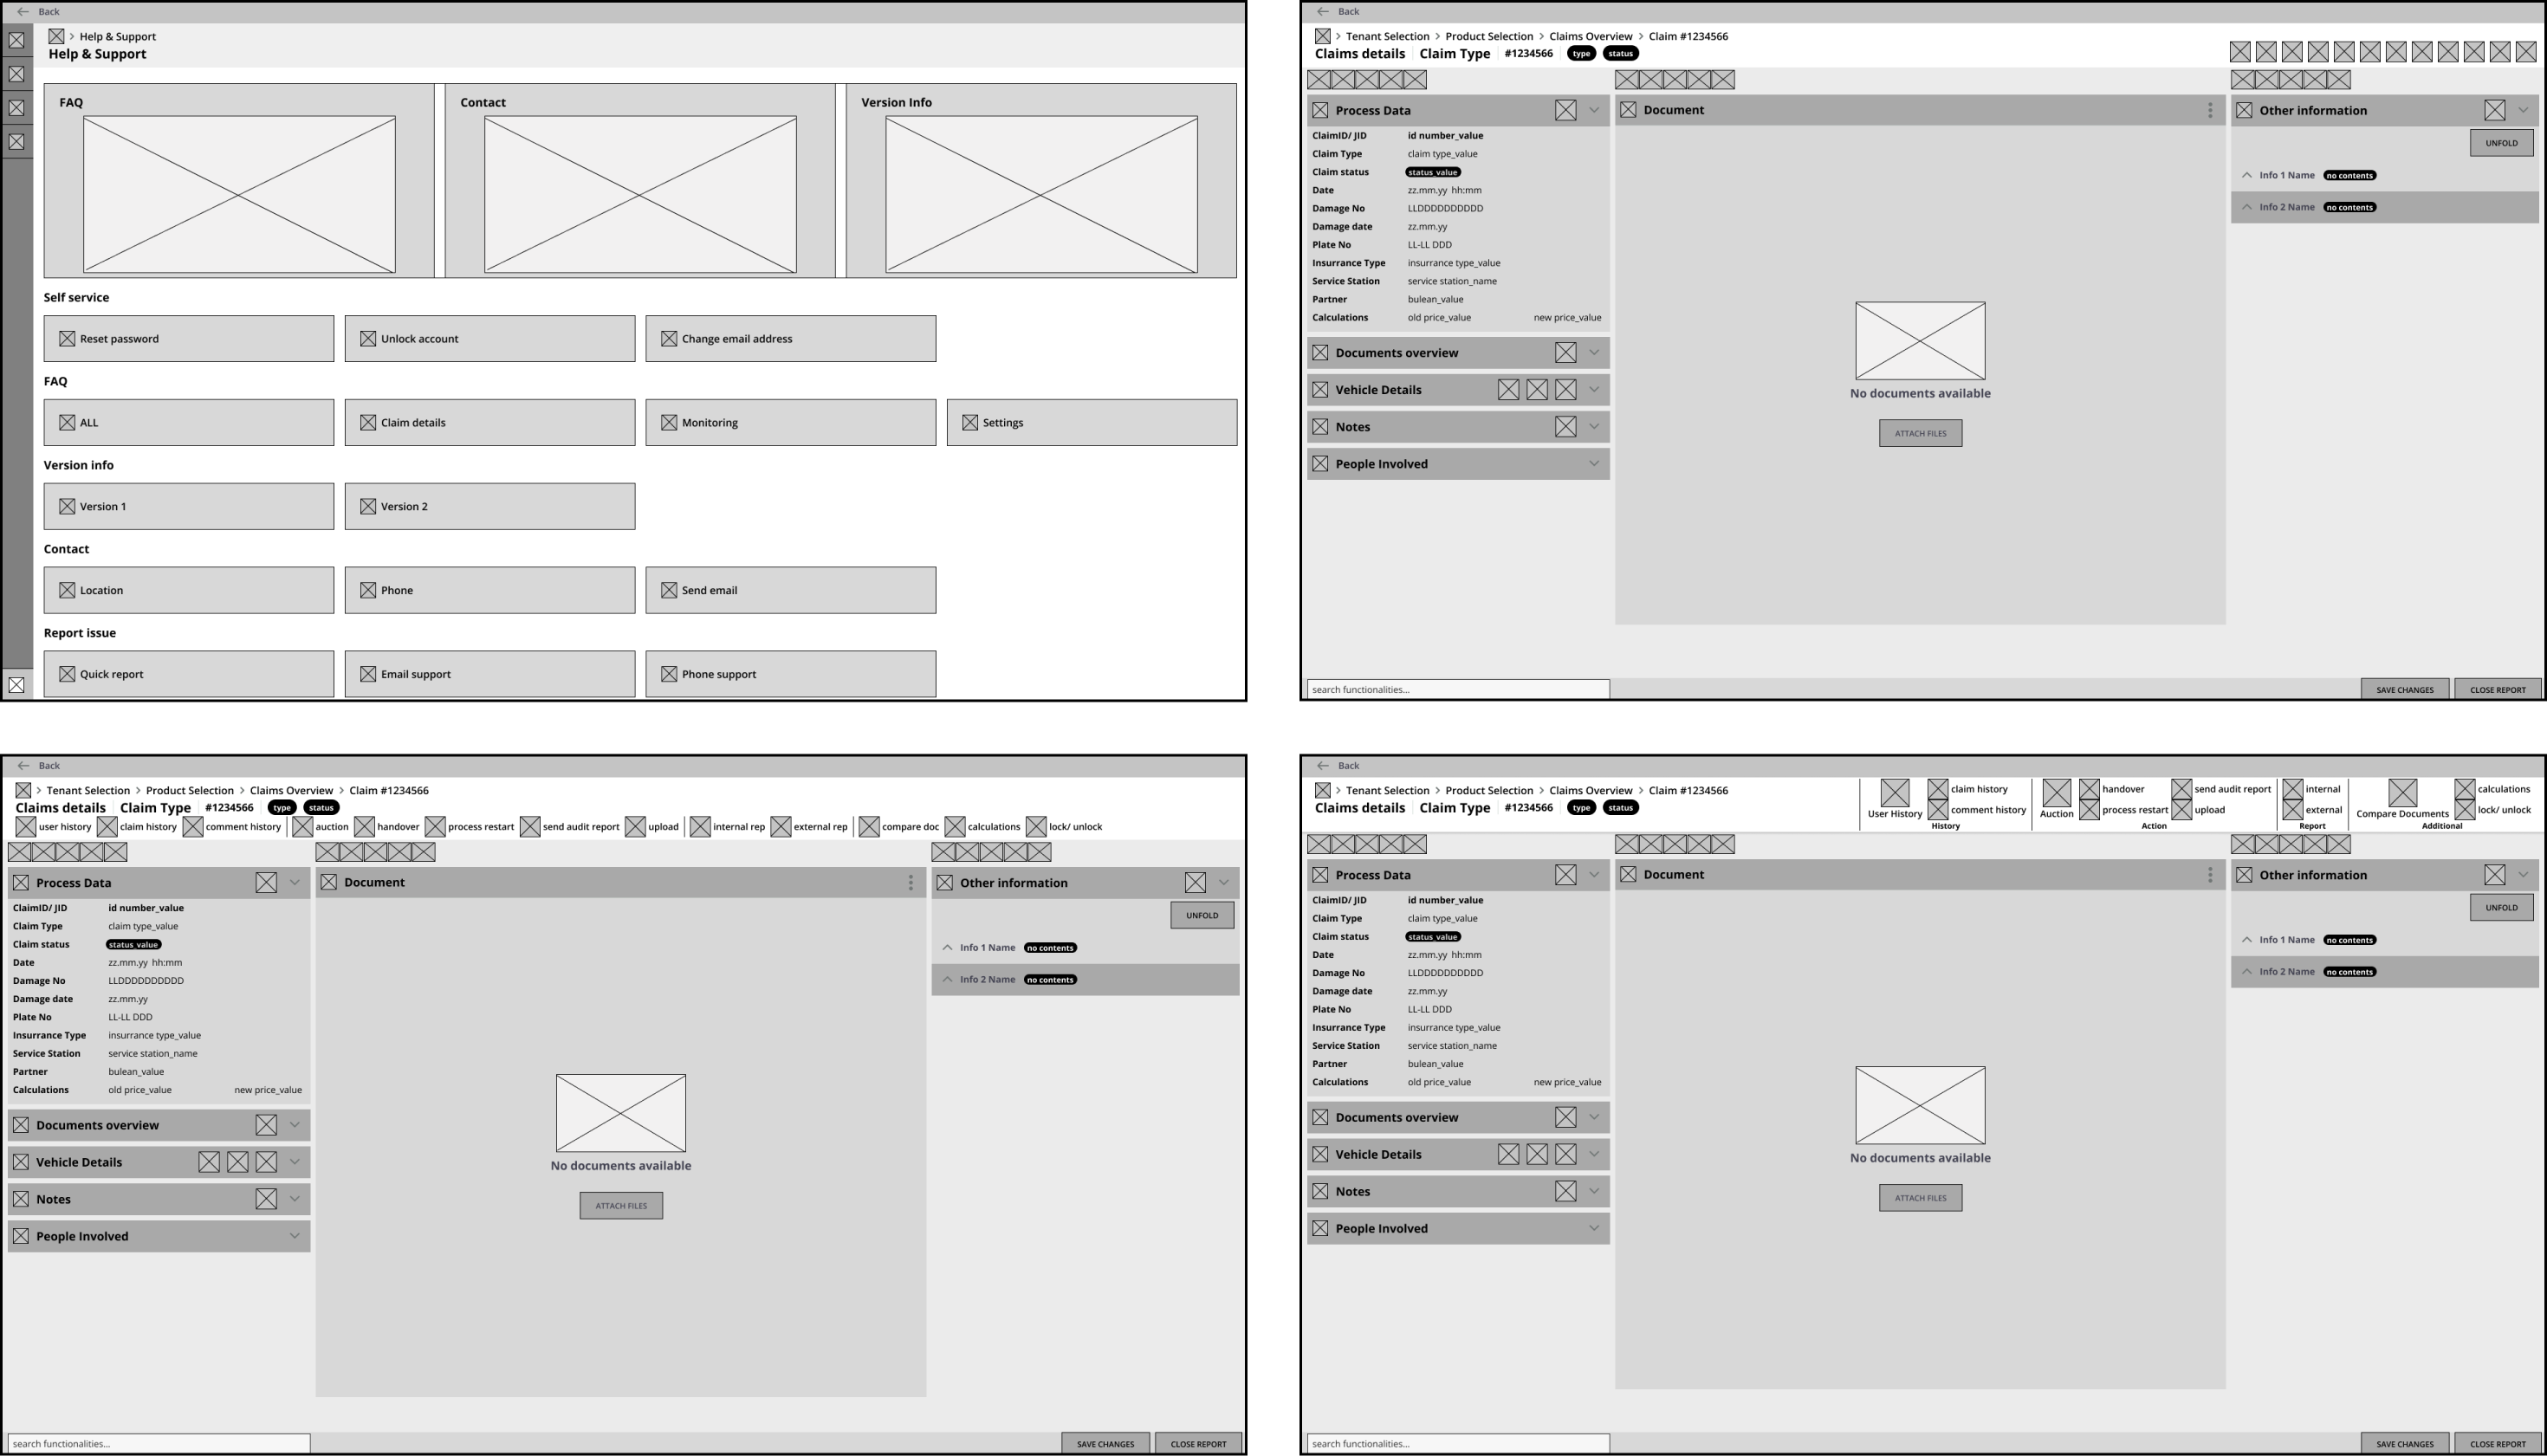
01
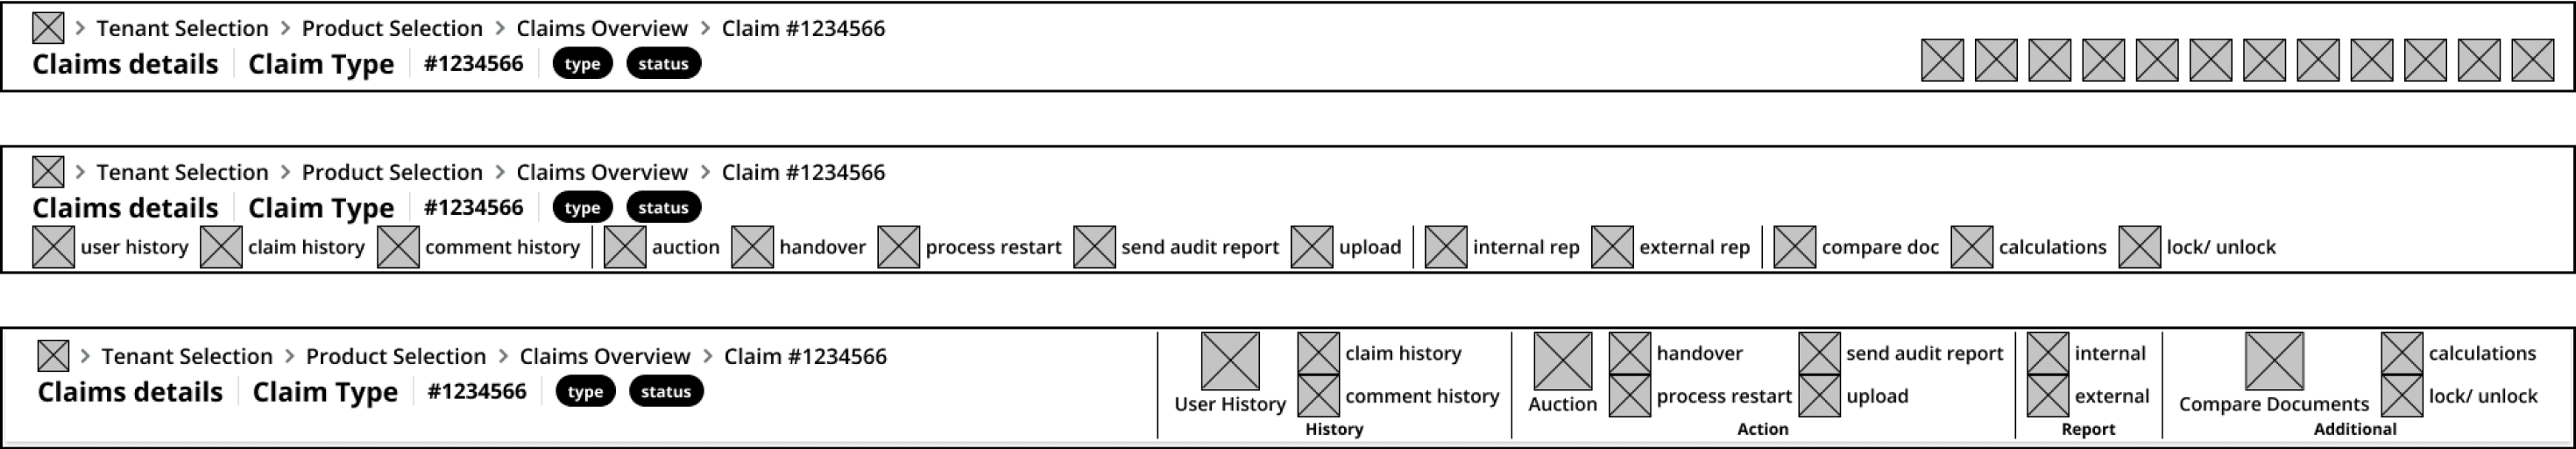
Wireframes & Information Architecture
The wireframes and layout were designed to build the structure and architecture of the information first, and only then move to visual design and interactions. This approach allowed faster iteration through ideas before committing to final UI.
02
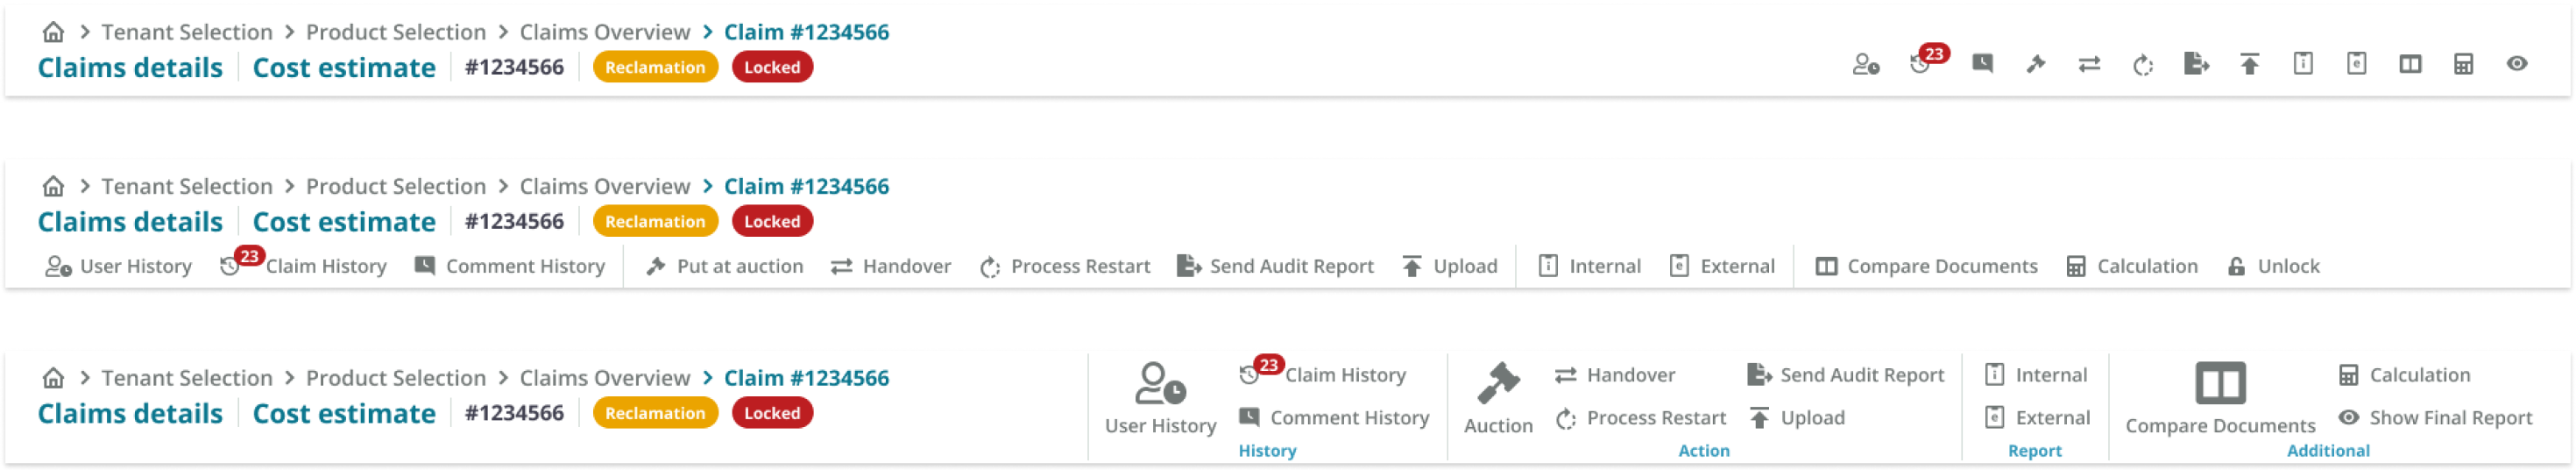
User Interface
The final interface was designed considering principles of contrast, hierarchy, and feedback, along with brand attributes, user interactions, and extensive data visualization requirements. Every screen was built to handle dense information while remaining clear and productive.
03
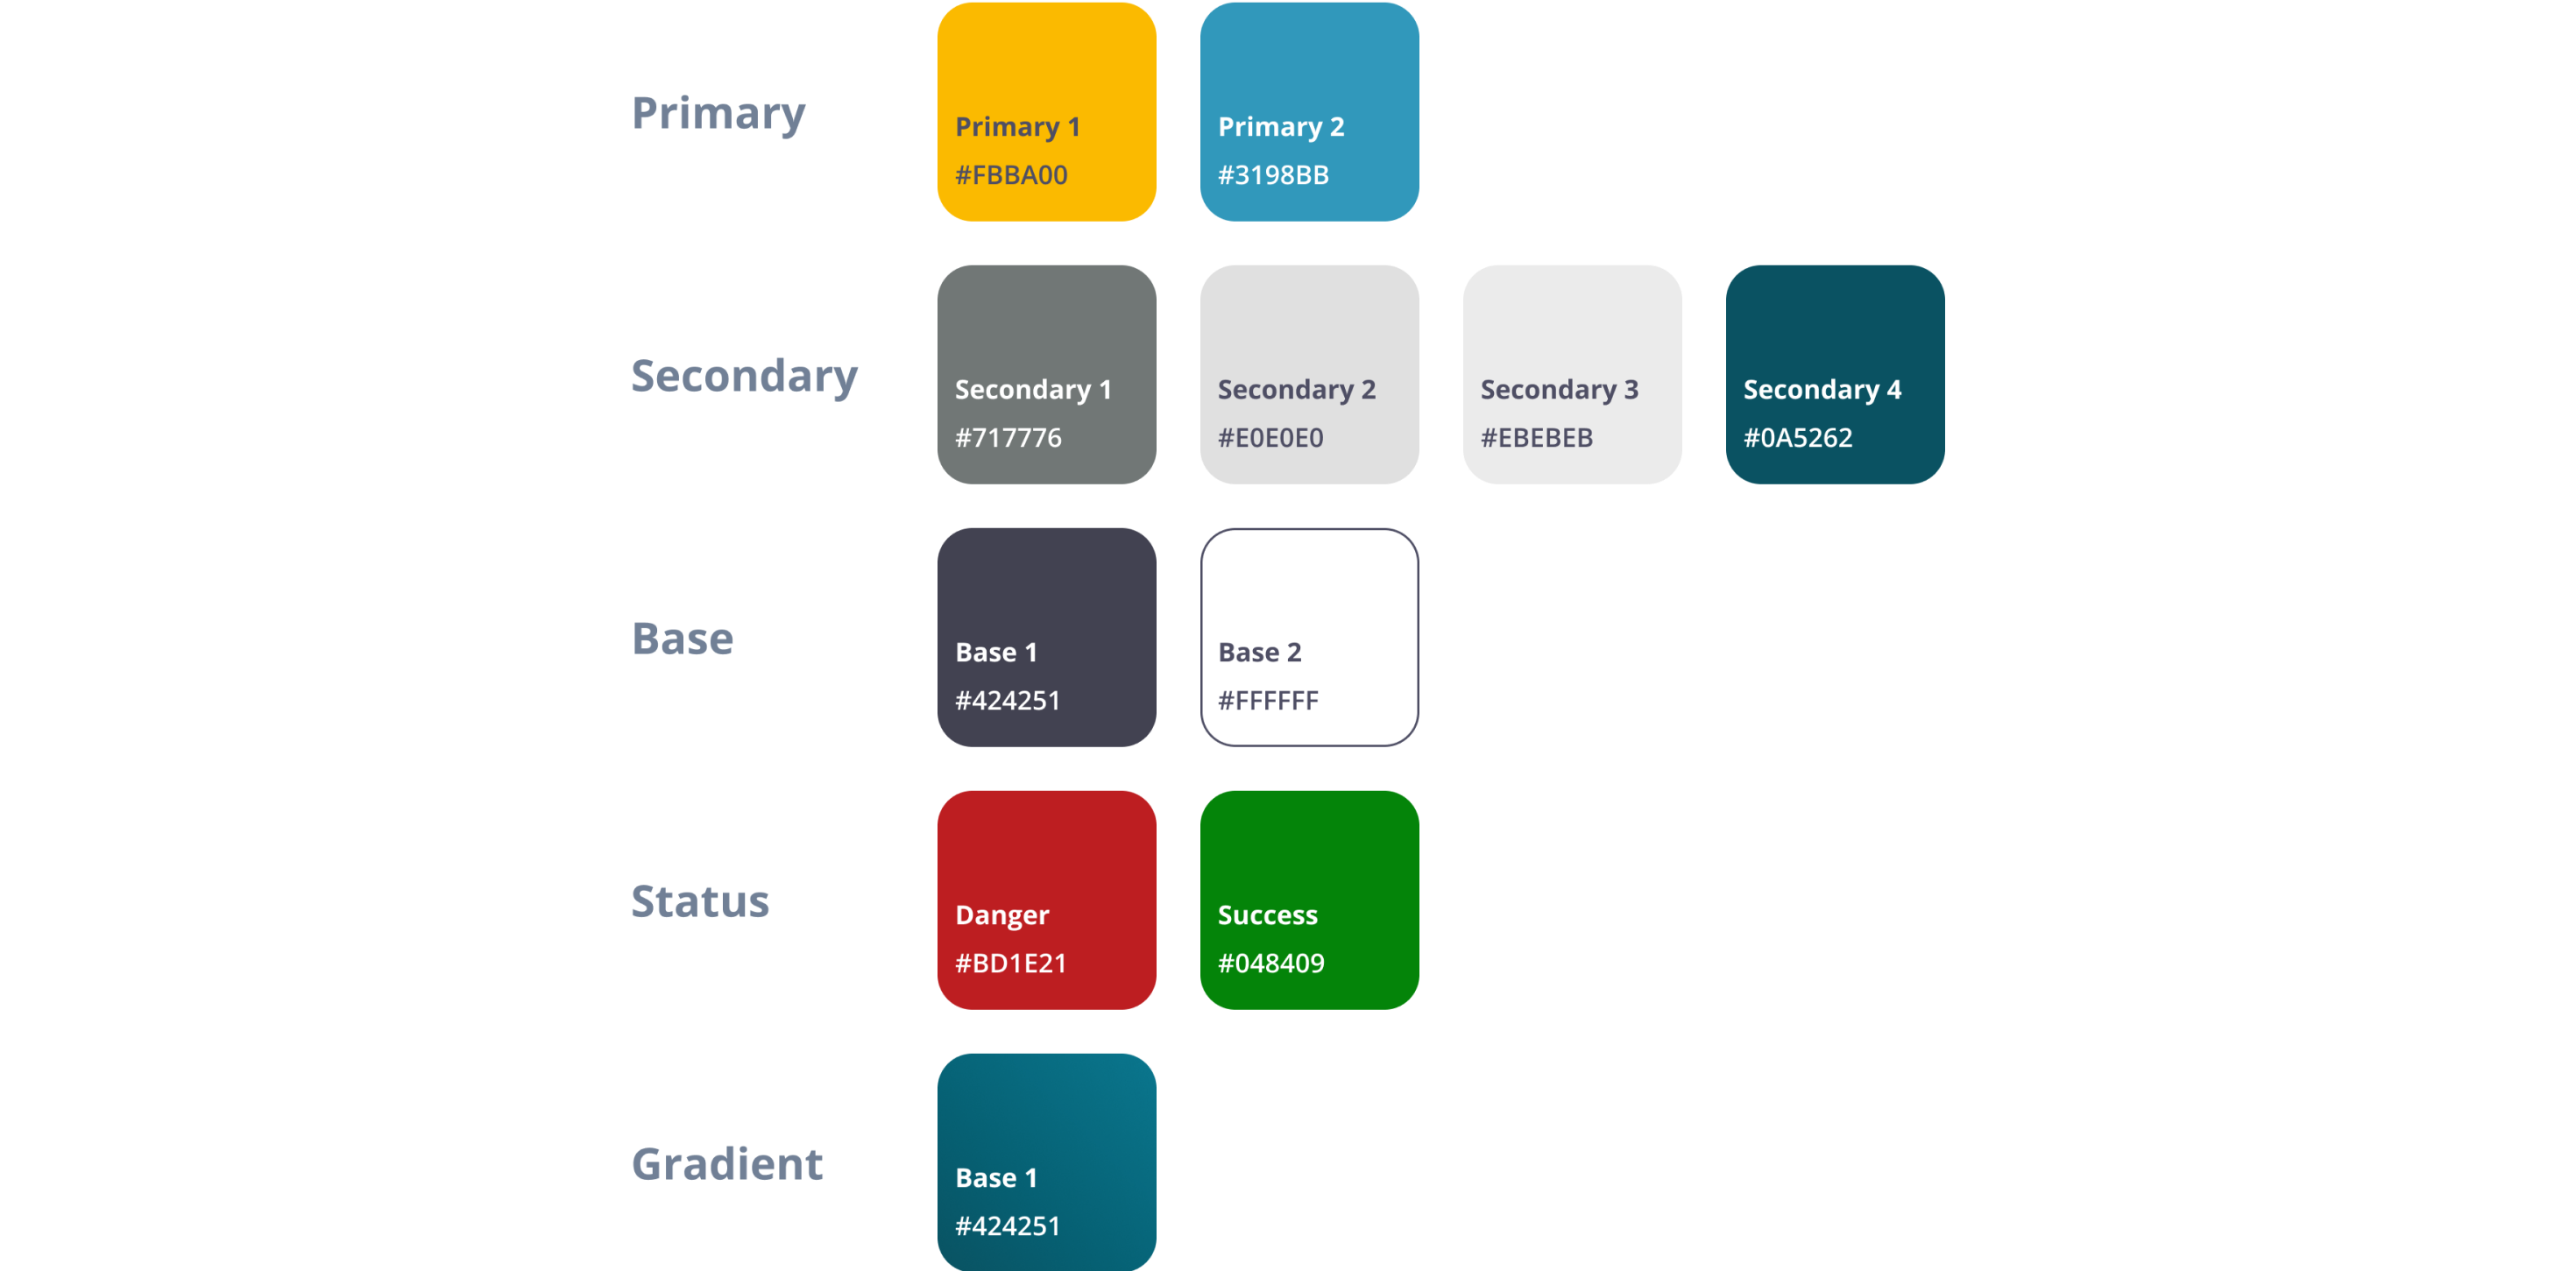
Color Palette
The brand guidelines led us to pick an inviting tone: yellow (brand color) for warmth, blue for contrast and useful information, red and green for danger and success status. For text, a much darker variation of blue and white ensures reading contrast and appropriate accessibility levels.
04
Typography
Since 75% of users have a technical background and work extensively with digits for calculations, we chose Open Sans, a font that is easy to read and doesn't create confusion between letters and digits. This was an opportunity to improve usability at the most fundamental level.

05
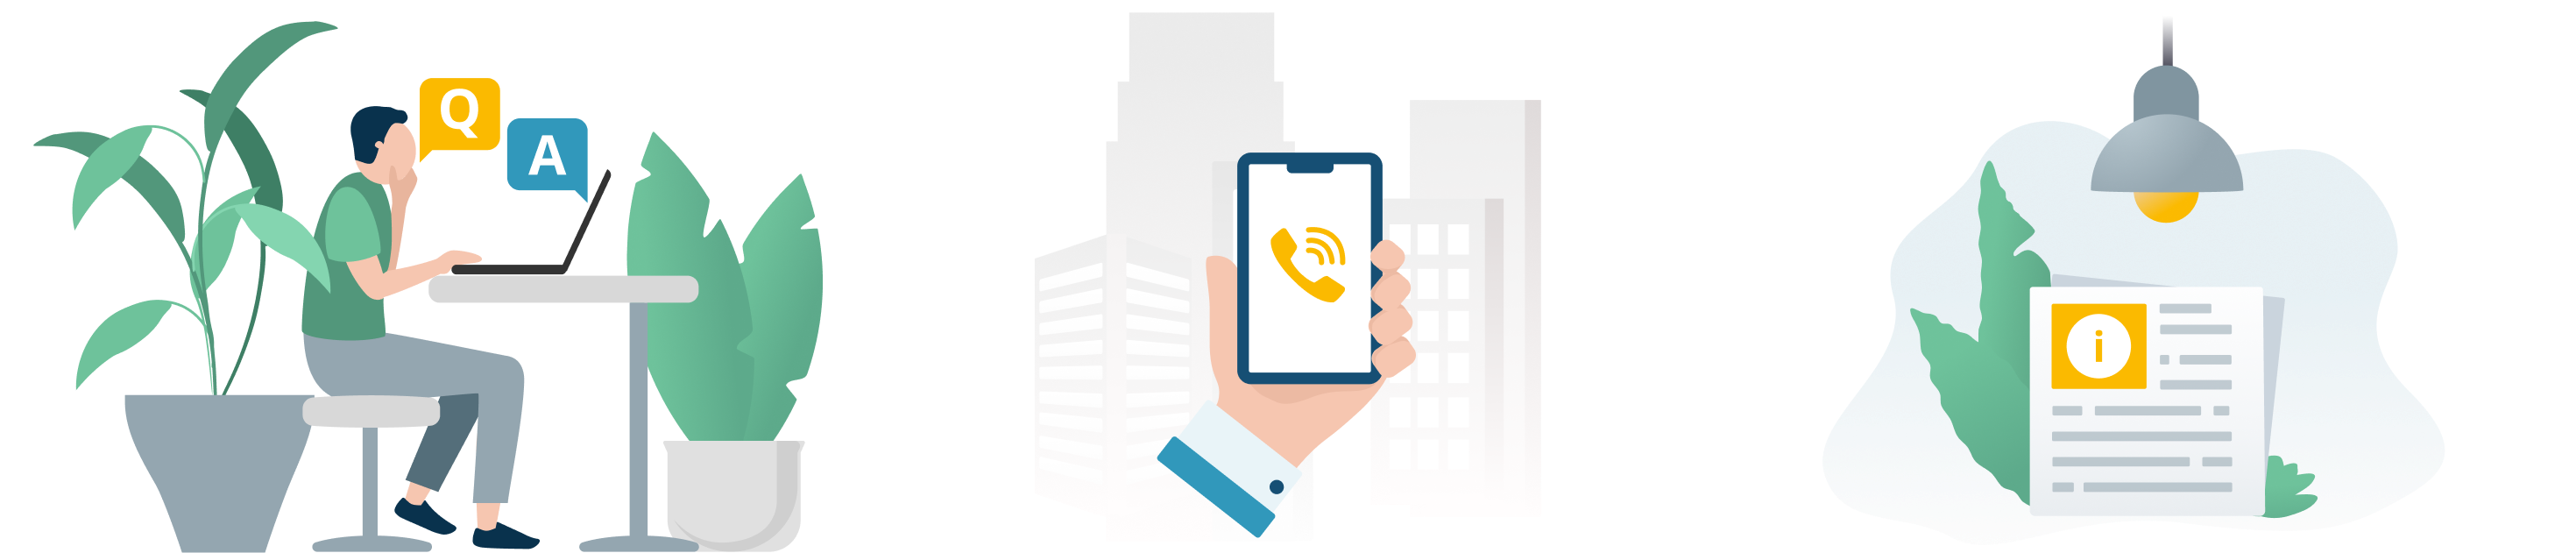
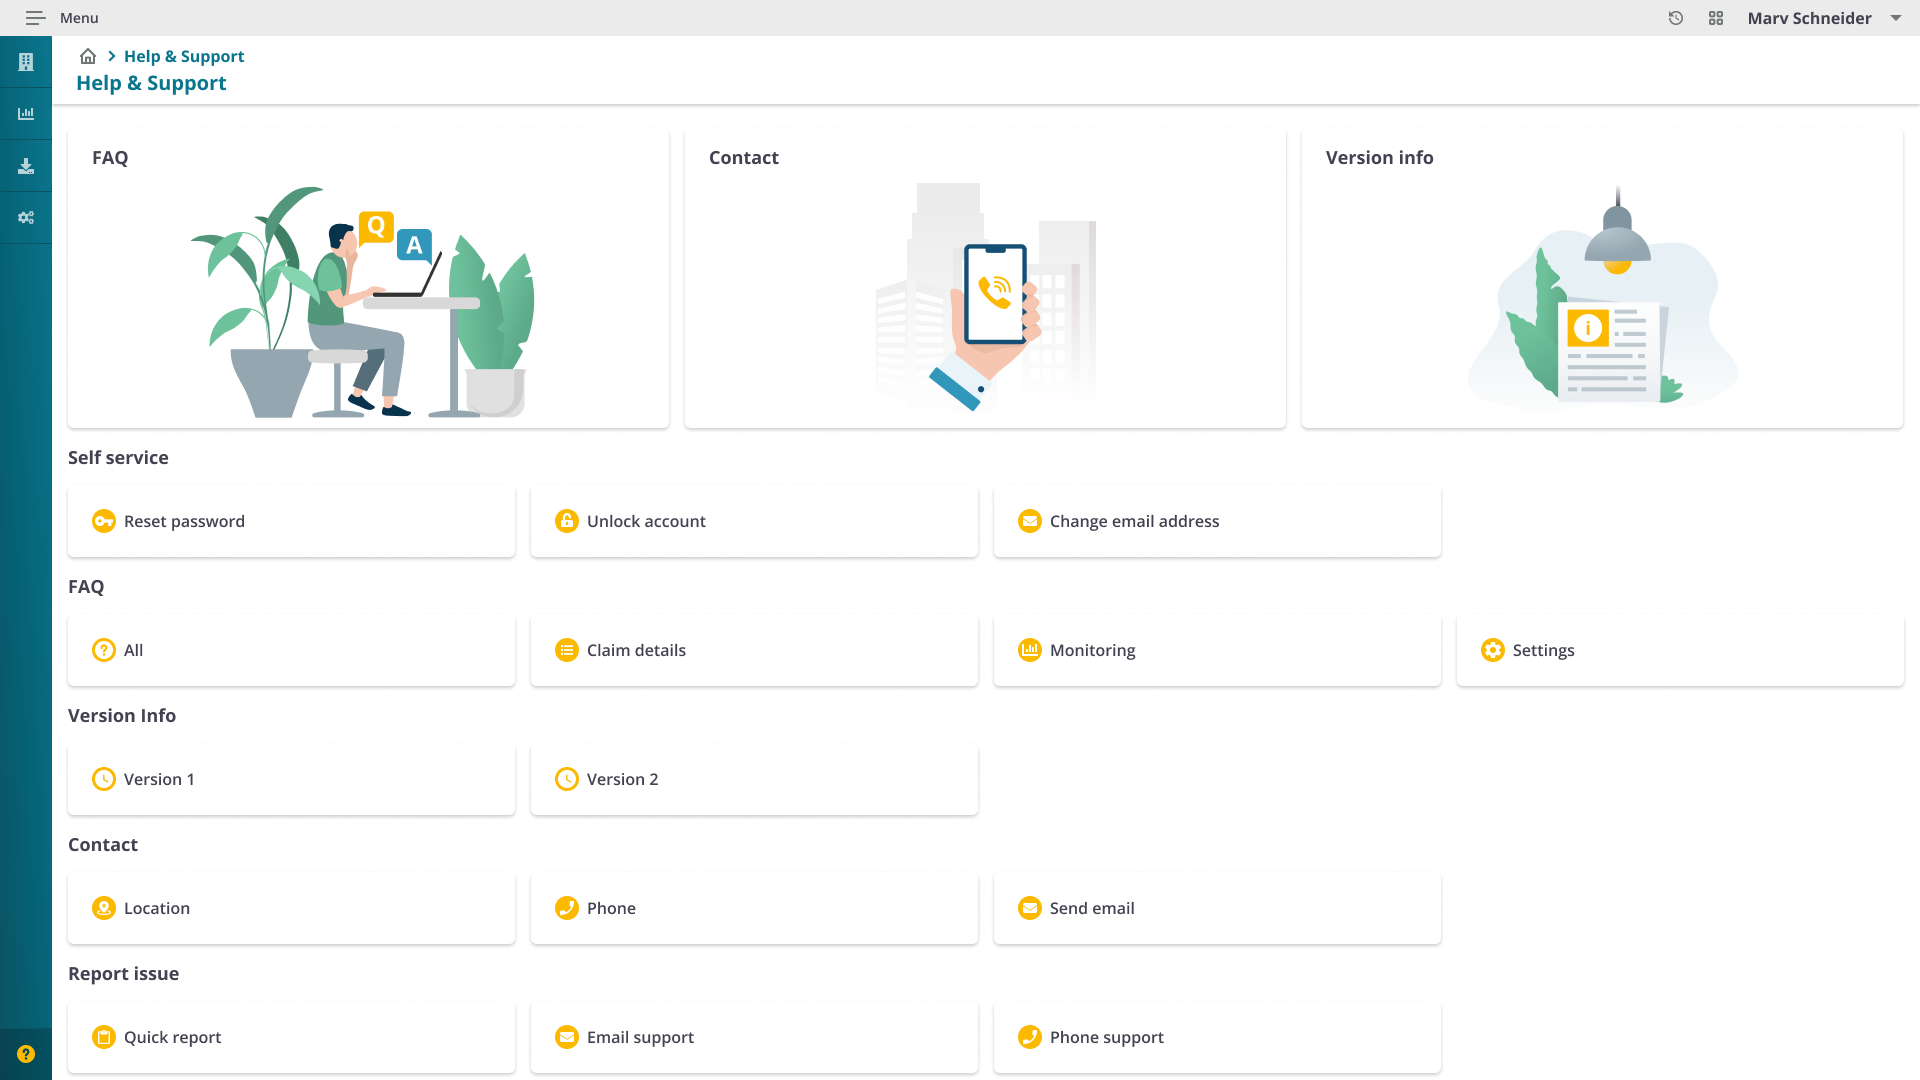
Custom Illustrations
To illustrate the Help & Support section, I started from open-source assets from Adobe Stock containing plants and office furniture. I created characters inspired by these assets' style and placed them in an office context, creating a warm feeling to make users feel like they belong in a community.
06
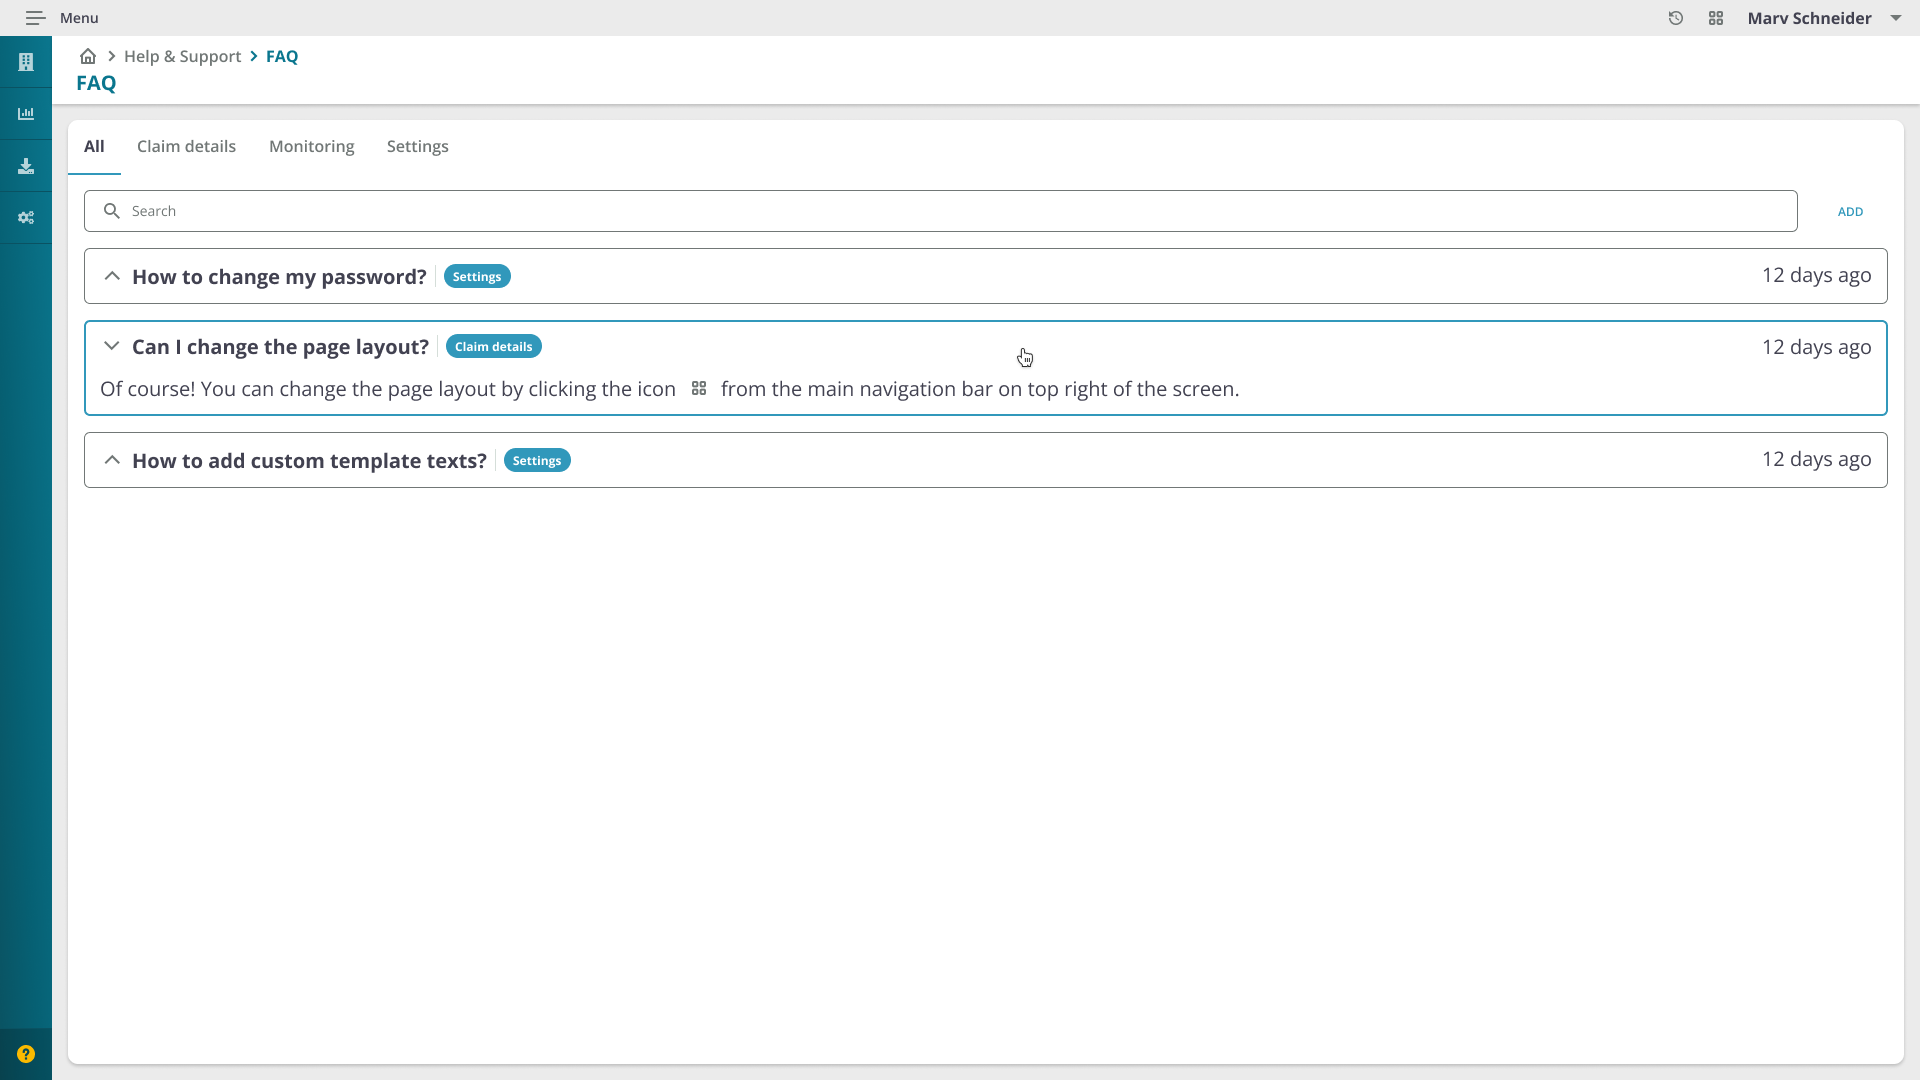
Breadcrumb Navigation
Implemented breadcrumb navigation for clear orientation within the complex claim management flow. Designed first in wireframes, then refined in the final UI, ensuring users always know where they are within the application hierarchy.
07
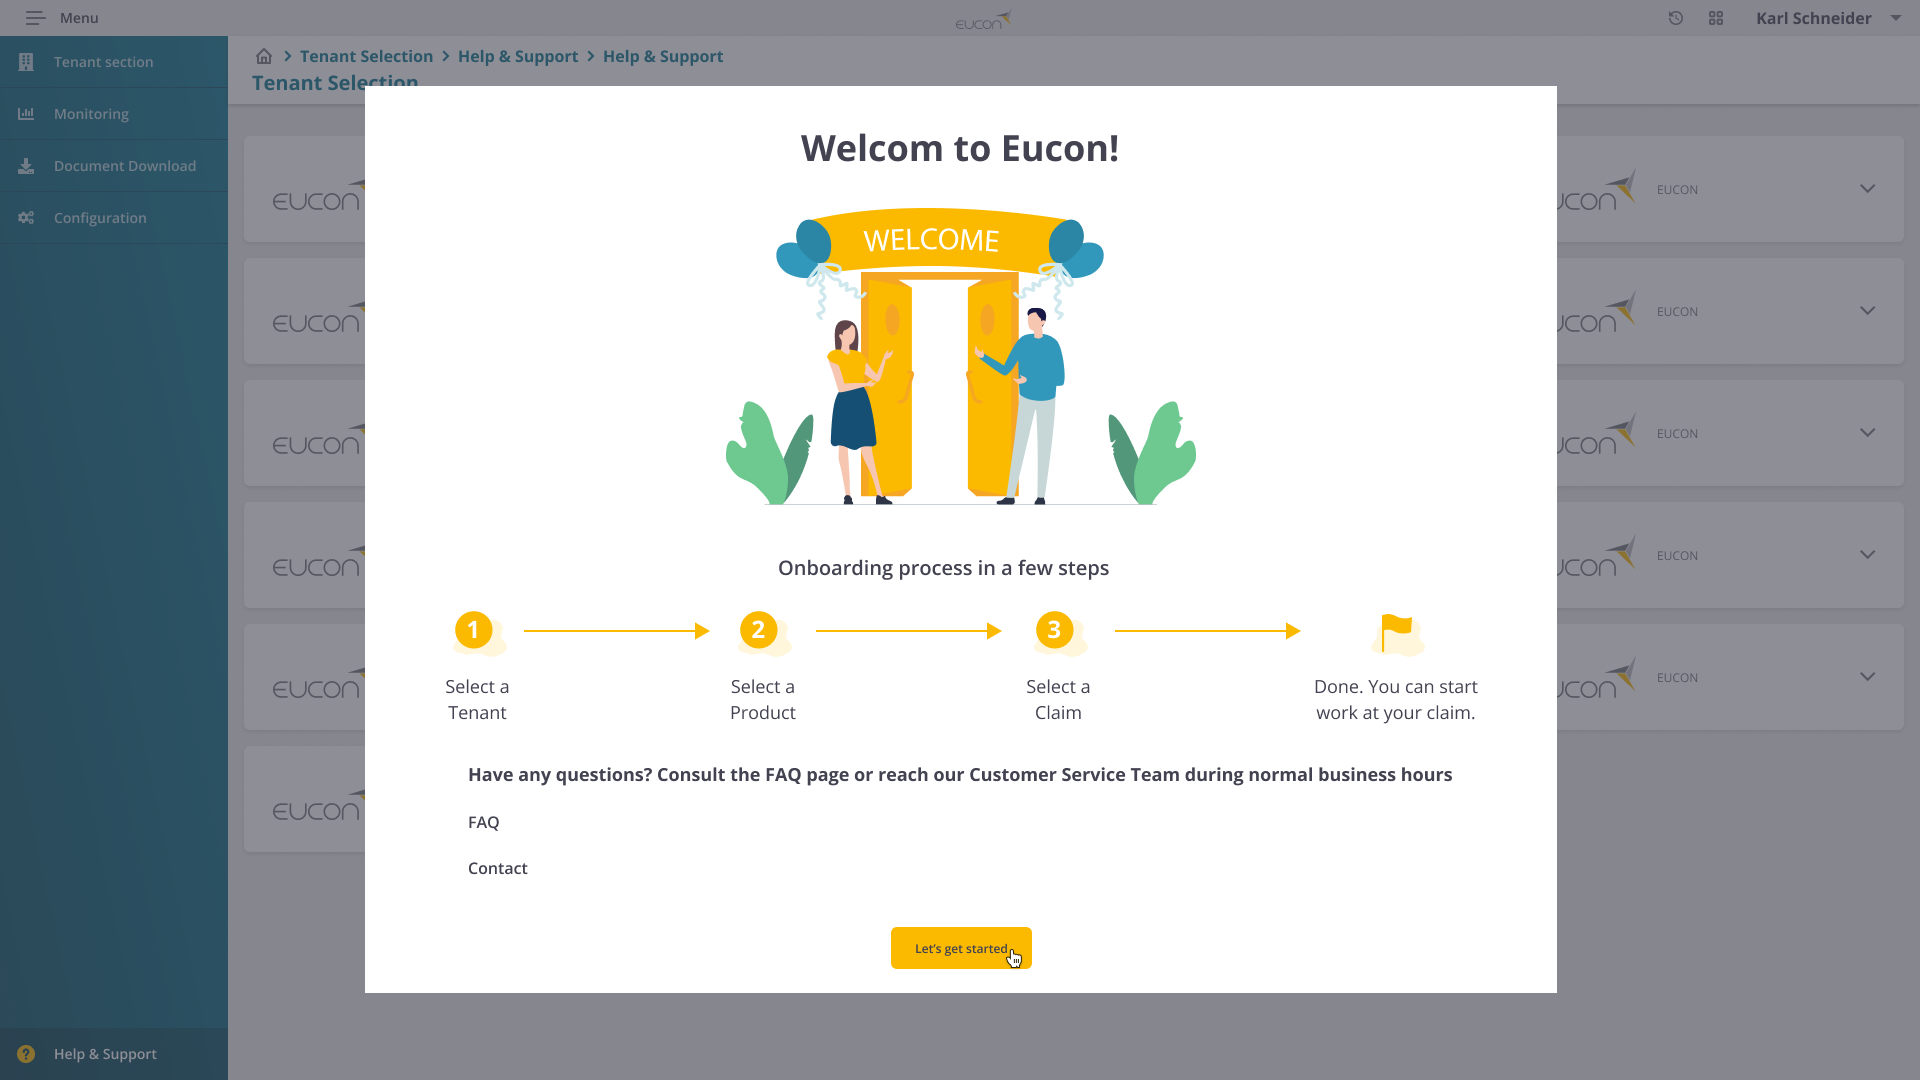
Onboarding & Help
Since this product is used by different insurance company employees, it's important that users understand the process of getting to a specific claim and start working on it. The onboarding screen appears only the first time a user goes through the flow. After opting in, it turns off and all information is available on FAQ and Help & Support pages.
Validation
Putting the user first at every stage
Eucon always puts the user first. We constantly validated ideas, user flows, and features using the prototypes created by the design team with small groups of users within organized workshops. We also received feedback from the development team before preparing the final prototype for the workshop.
This way, analyzing the feedback and the ease of use of new features and flows enabled me to improve the product and users' productivity while using it.
My Biggest Learnings
Gradual change beats big redesigns for enterprise products
Introducing improvements sprint-by-sprint let users naturally learn and adapt rather than being overwhelmed by a complete overhaul. The key was making changes unintrusive, beneficial but never disruptive to established daily workflows.
Research with 10 users surfaces 80% of the issues
Following Donald Norman's research principle, 10 interviews were enough to identify the most critical pain points and user behaviors. The 45-minute format allowed deep exploration of workflows, device habits, and specific frustrations.
A design system is a multiplier, not overhead
Building a reusable component system felt like extra work upfront, but it ultimately cut design and development time by 37% and ensured visual consistency across the entire application, critical for a data-heavy enterprise tool.
Testimonials
Kind words from the team

"It was a pleasure to work with Roxana. Her positive charisma and communication skills have enriched the team. Roxana has a high level of comprehension and can quickly familiarize herself with complex topics. She has excellent experience in the UI/UX area and has enriched our complex applications. I would especially like to highlight her illustration skills."

"Roxana is a great asset to any company that has the goal to have the best UX. She is positive, always puts a smile on my face and willing to help at any time. She has an incredible vibe and is also an amazing team member to work with. One of the greatest skills that she has is that she is a very analytical person and she takes care of the details. She has helped me with my onboarding and always with patience and with a lot of ideas on how to improve. She is a person with a lot of passion and love for her work and profession."
A big thanks to the people who participated in discovery workshops and user interviews, and who gave us feedback to improve the final product. In particular, I would like to thank Fabian Snethkamp and Elena Radut.